Those of us who regularly work in PowerPoint have come across add-ons with promises to enhance productivity and make our lives easier. Many of these add-ons just make existing PowerPoint features a bit easier to access, but occasionally a piece of software comes along that has the research behind it to solve a real problem for the user. think-cell is one of these roses in amongst the thorns. It is a graph and layout automation tool that promises to make slide creation quicker and easier.
Earlier today (June 11th 2018), think-cell announced and launched a new version of its software. If you are one of the 600,000 active think-cell users, you have already been taking advantage of their chart and layout automation functions, which have been shown to cut slide creation time by up to 70%. This latest update looks to enhance think-cell from a data-driven chart engine to include big data reporting capabilities and automatic layout generation.
I was lucky enough to get a special sneak preview of the latest version, and the inside scoop on the best features of the update from CEO and co-founder Markus Hannebauer.
What is think-cell all about?
Hannebauer and co-founder Arno Schoedl noticed that PowerPoint users are often reusing the same layouts for slides many times over and spending lots of time doing tedious formatting adjustments. think-cell was created to help people “save time developing beautiful slides and presentations”, says Hannebauer. As someone in the business of making beautiful presentations, I was curious about what that means to Hannebauer:
“We’re not in the business of doing creative design, neither the software nor the company is about inventing new visualization options, that’s with the graphics experts and our customers! We are in the business of taking away the tedious work that people have to do on repetitive tasks through automation. It’s about helping people to make adherence to corporate branding easier, quickly create compelling slides, and avoid pitfalls like forgetting to update data.”
So, think-cell helps users achieve beauty through consistency and elegance, automating and correcting many of the things we tend to get wrong. To find out more details about how they enable this, check out their comprehensive YouTube tutorials.
Three key features of the update
Now let’s get to the juicy stuff! There are three main components of the think-cell 9 update, all of which show the company’s fierce dedication to continually improving technology. Let’s start with the feature I’m most excited about: chart capture.
Chart capture
Here is a situation that is all too familiar to some: you find a report with lots of great data that you want to include in your presentation. But you don’t have access to the original dataset, all you’ve got is an image of a graph, or perhaps a PDF. At this stage, your three options to get this onto your PowerPoint slide are to:
Copy-paste in the image: but this probably doesn’t match your brand.
Trace over the image with PowerPoint shapes or a Microsoft pen: but this can be inaccurate.
Try to extract the text using Microsoft OneNote (we have a tutorial on this here): but this only works if your chart has data labels.
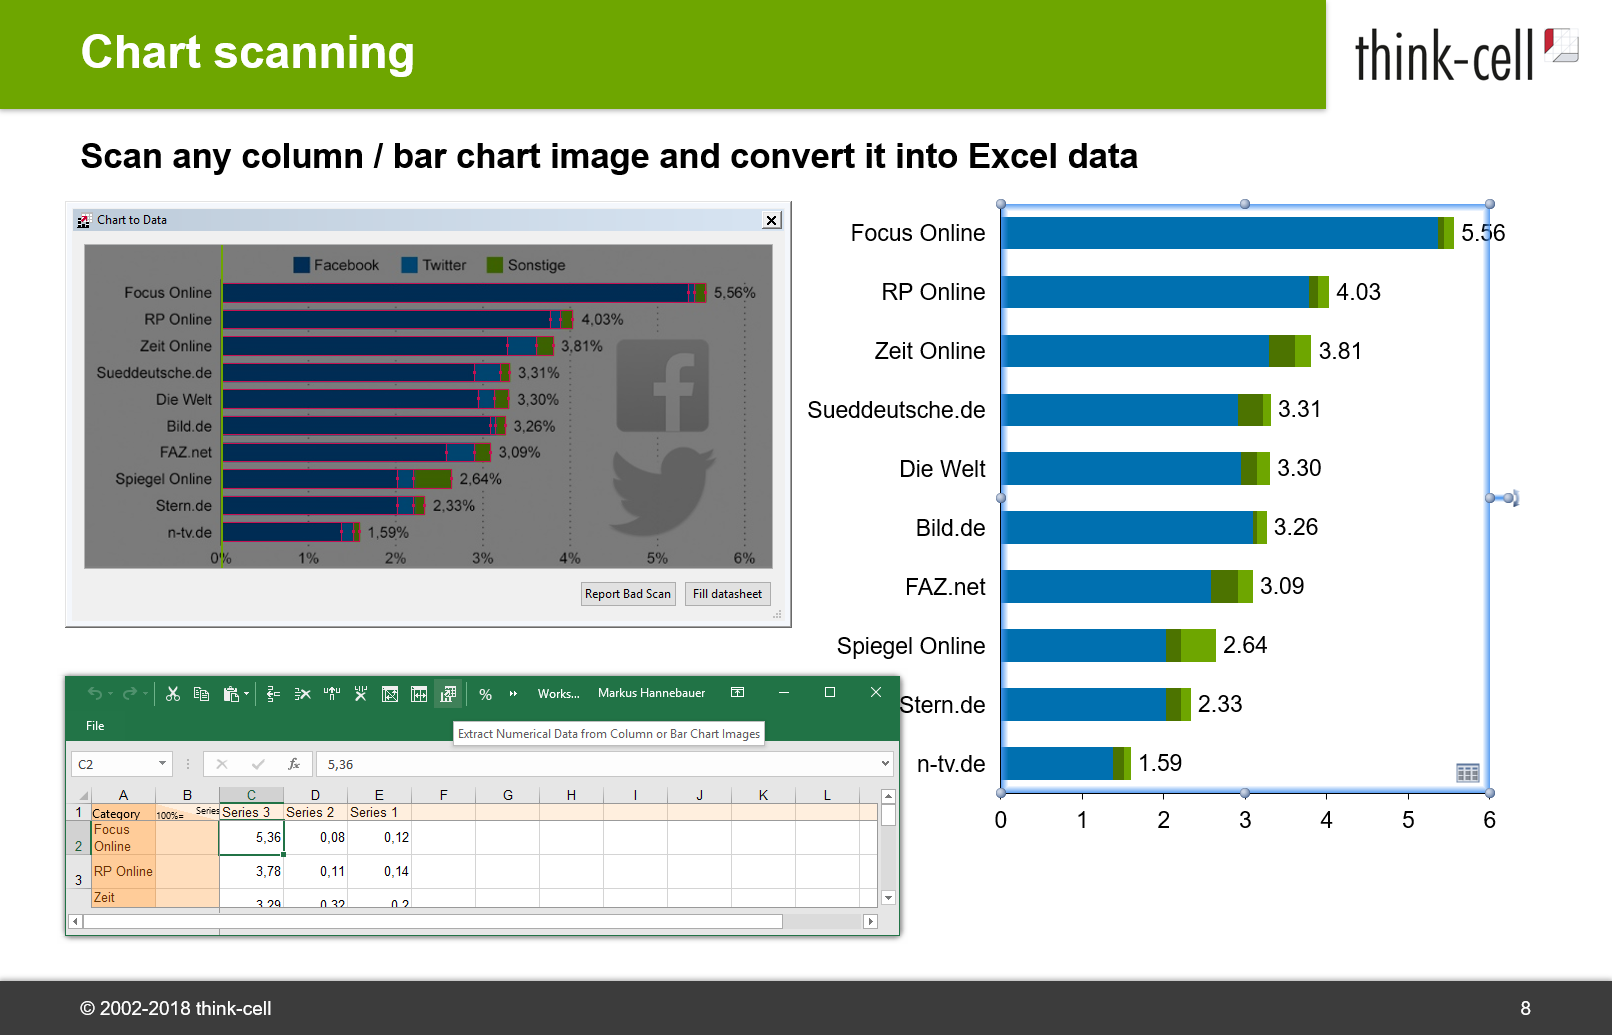
Within think-cell 9 there is a new button in Excel: Chart to Data. Selecting this will launch an AI engine that combines research in computer graphics, AI algorithms, and character recognition. You just need to adjust the engine’s window to select an area on your screen, and it will start recognizing axes, figures, and even data labels. This will then output everything into a nicely organized Excel spreadsheet.
Within a few seconds, you can use this data to create a graph or chart in PowerPoint (and if you’re not sure how to do that, check out our free graphs and charts resource). Not only is this approach way faster than trying to mimic the chart yourself, but it’s also much more accurate. This feature is currently available for simple and stacked bar and column charts, and future updates plan to extend this to bubble, line and scatter charts.
Cloud based updates
It is possible to link external Excel spreadsheets to PowerPoint graphs by using macros, and past versions of think-cell have made linking and live updating much easier. In recent years, though, there has been more demand for linking to cloud databases.
With think-cell 9 you will be able to link any on-premise or cloud database to a chart in PowerPoint through a simple JSON-based interface. This means that you can automatically update presentations from internet sources and export huge amounts of information into data-driven charts, all within a single PowerPoint presentation. This provides a simple and elegant way of visualizing big data quickly. It will also be an enormous time save for those who frequently present reports, says Hannebauer:
“Instead of recreating the same report again and again you can just make one report as a template, and then inject data automatically into a presentation over, and over again”
Automatic layouts
The last key feature of the think-cell 9 update is automatic layouts. Some skeptics may say that PowerPoint already has features like SmartArt that help you do this quicker. But I would counter that SmartArt offers so little flexibility as to be unfit for purpose. Hannebauer is in agreement:
“SmartArt is so restricted, you can only do one concept at a time and we’re after something much more flexible. We don’t want users to be forced into a certain visual straitjacket. SmartArt is not the real solution to PowerPoint layout, we’re after the real solution and I think we’ve done it”.
Automatic layout has solved for a lot of my pain points with SmartArt. For example, SmartArt restricts how you animate objects in and out. While you can always ungroup your shapes and animate them after the fact, once you ungroup you lose the automation, which makes future updates more complicated and cancels out the benefits of using SmartArt in the first place. In contrast, when you create a custom layout using think-cell, it is treated as individual objects. This means you can easily reformat and animate objects with precision, without losing key functionality.
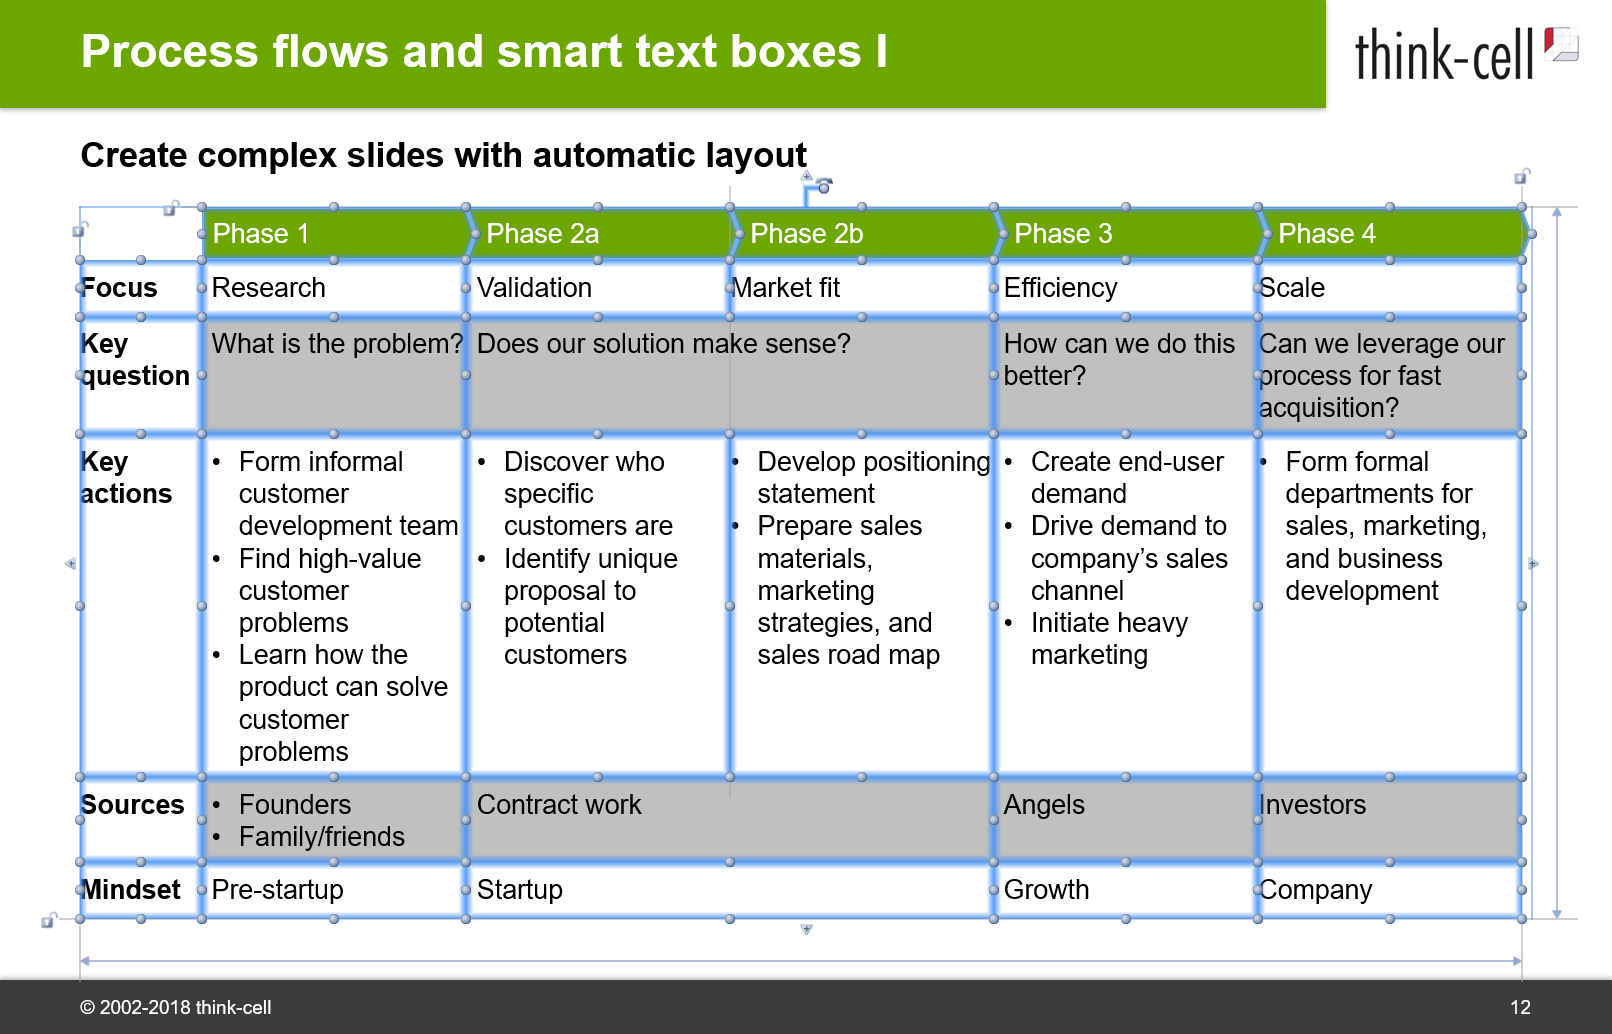
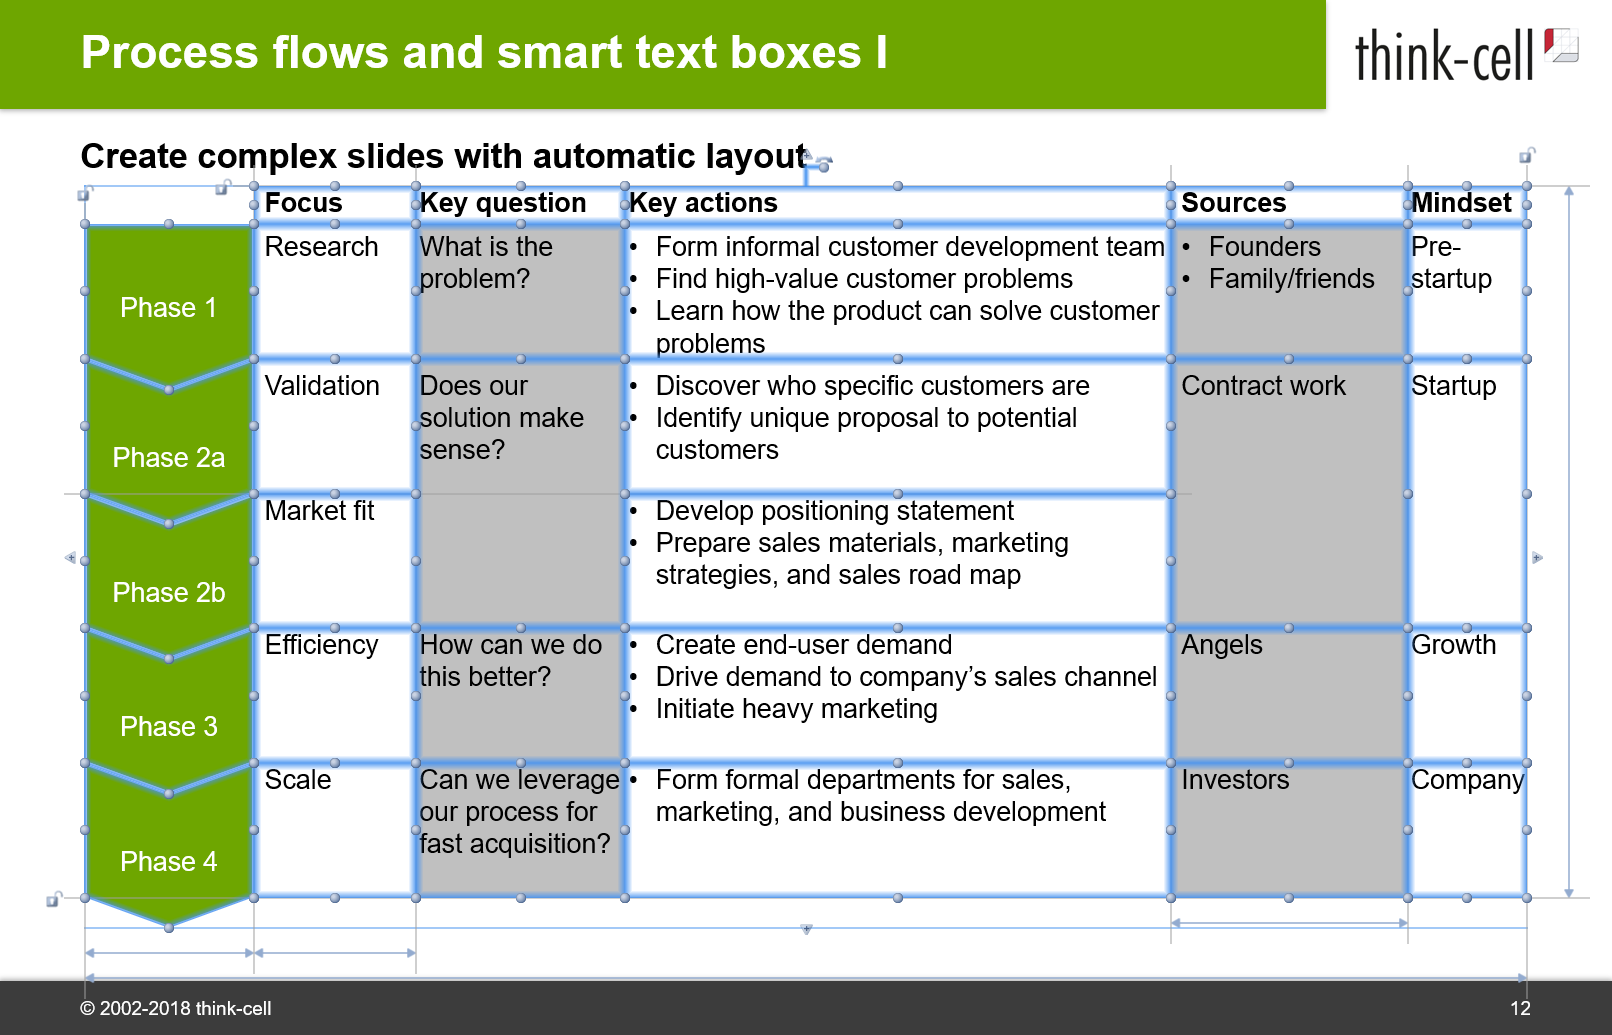
Automatic layout automatically resizes and repositions, but still lets you be in control. It’s an intelligent feature, so if – for example – you rotate a table, it knows to keep relevant cells together. See how this works by comparing the before and after screenshots below:
If you are getting super excited about all the reports you are going to be able to create and how many PDFs you’re going to turn into live charts, the good news is that this update is immediately available for purchase or free trial. So, you can download the free trial now and get started today!
If you love the free trial and want to purchase the full version, a single user license costs about $250/year. There is of course economy of scale and think-cell have a calculator on their website to help you work out the cost for your specific situation.
think-cell is compatible with Microsoft Office 2007 all the way up to the on-premise versions of Office 365. If you are a Mac user, you will have to just wait a bit longer until think-cell 10 is released. This version will be compatible with Mac Office, and a preview is available for everyone.
The BrightCarbon team and I will be keeping a watchful eye over future think-cell updates, as we know exciting things will be coming out of this company! Keep checking back on our blog for more updates on forthcoming think-cell software versions, and our regular reviews of all things presentation technology.
The National University of Singapore have developed an add-on software called PowerPointLabs. If you are an ambitious PowerPoint user who doesn’t have time to fiddle around with learning all the tricks that experts such as the BrightCarbon staff have figured out, then you may find PowerPointLabs to be very helpful.
Glisser is an online platform that allows you to create interactive presentations that can be used for marketing, training or any other type of events. The site has different functions available for presenters, attendees at events and event planners which all focus on allowing for increased presenter-audience interaction. Since creating engaging visual presentations is what we do, I decided to take a closer look at Glisser and see what it’s all about and how the various functionalities work.
Jamie Garroch puts the ‘power’ in PowerPoint add-ins. He’s written code for dozens of amazing functionality boosters, some for specific organizations and some available for all users, and he's joining the BrightCarbon team! Read on to learn about the experience that Jamie is bringing to BrightCarbon and how it will help clients and the presentation community use PowerPoint more effectively.
“[…] a single user license costs about $250/year.”
You talk about ThinkCell single-user licenses. Where do you find those? The ThinkCell web page seems to force minimum 5 users. Please respond – millions are wondering this same thing.
It may be a regional thing, but if so, there’s also a think-cell fees PDF that’s linked to from the page above, which also shows the cost of 1-1000 licenses, and everything in between – https://www.think-cell.com/en/pdf/think-cell_fees_usd.pdf


“[…] a single user license costs about $250/year.”
You talk about ThinkCell single-user licenses. Where do you find those? The ThinkCell web page seems to force minimum 5 users. Please respond – millions are wondering this same thing.
Hi. We got it from their new order webpage, which shows a table of licenses with a single license for $247.50 – https://www.think-cell.com/en/order/new.shtml
It may be a regional thing, but if so, there’s also a think-cell fees PDF that’s linked to from the page above, which also shows the cost of 1-1000 licenses, and everything in between – https://www.think-cell.com/en/pdf/think-cell_fees_usd.pdf