When it comes to charts, PowerPoint provides you with a cornucopia of options. I see it like walking into your local sandwich shop and staring down at long glass cabinets full of delicious ingredients. “Would you like bar, line or bubble to start? Care for a dusting of axis, titles or legends? Can I sway you for a gridline, or two? Would you like to make your chart a duo and include a dessert? We have doughnuts!” Anyone feeling hungry?
But have you ever walked out of the shop feeling smug, strolled back to the office, and taken your first bite only to realize they forgot to add your hot sauce?! Tragedy! The sandwich is fine, it’s serving its purpose, but it’s lost its spice! And you’ve lost your appetite…
Placing that analogy on the shelf for a second, one of best things about charts in PowerPoint is that they’re ‘live’. Made a mistake inputting your weekly sales revenue? Not a problem! Hit Edit Data, tweak the worksheet and then close it. As if by magic the chart updates, and if you catch it fast enough, your boss won’t even notice. The problem is that these live charts can look a little dull. They have no spice! In fact, I’ve battled for a long time trying to make PowerPoint live charts more appealing.
Non-live charts – charts made using PowerPoint shapes or images – are easier to jazz up. You can use fun shapes, dynamic animation, and bold images to get creative. However, they are much fiddlier to edit. If you want to update the data in your graphs and charts regularly, live charts are the best option!
And, after lurking in PowerPoint’s preset charts section for far too long, I believe I have the answer. It just takes a little ‘out of the box’ thinking! And luckily, using live charts doesn’t mean that your data has to be dull. So, let’s go get our chart ‘spice’ back.
As I have a sweet tooth, I’m going to demo this approach with a doughnut chart. Let’s say I surveyed 100 people about whether they like doughnuts, pizza and tacos and the results were:
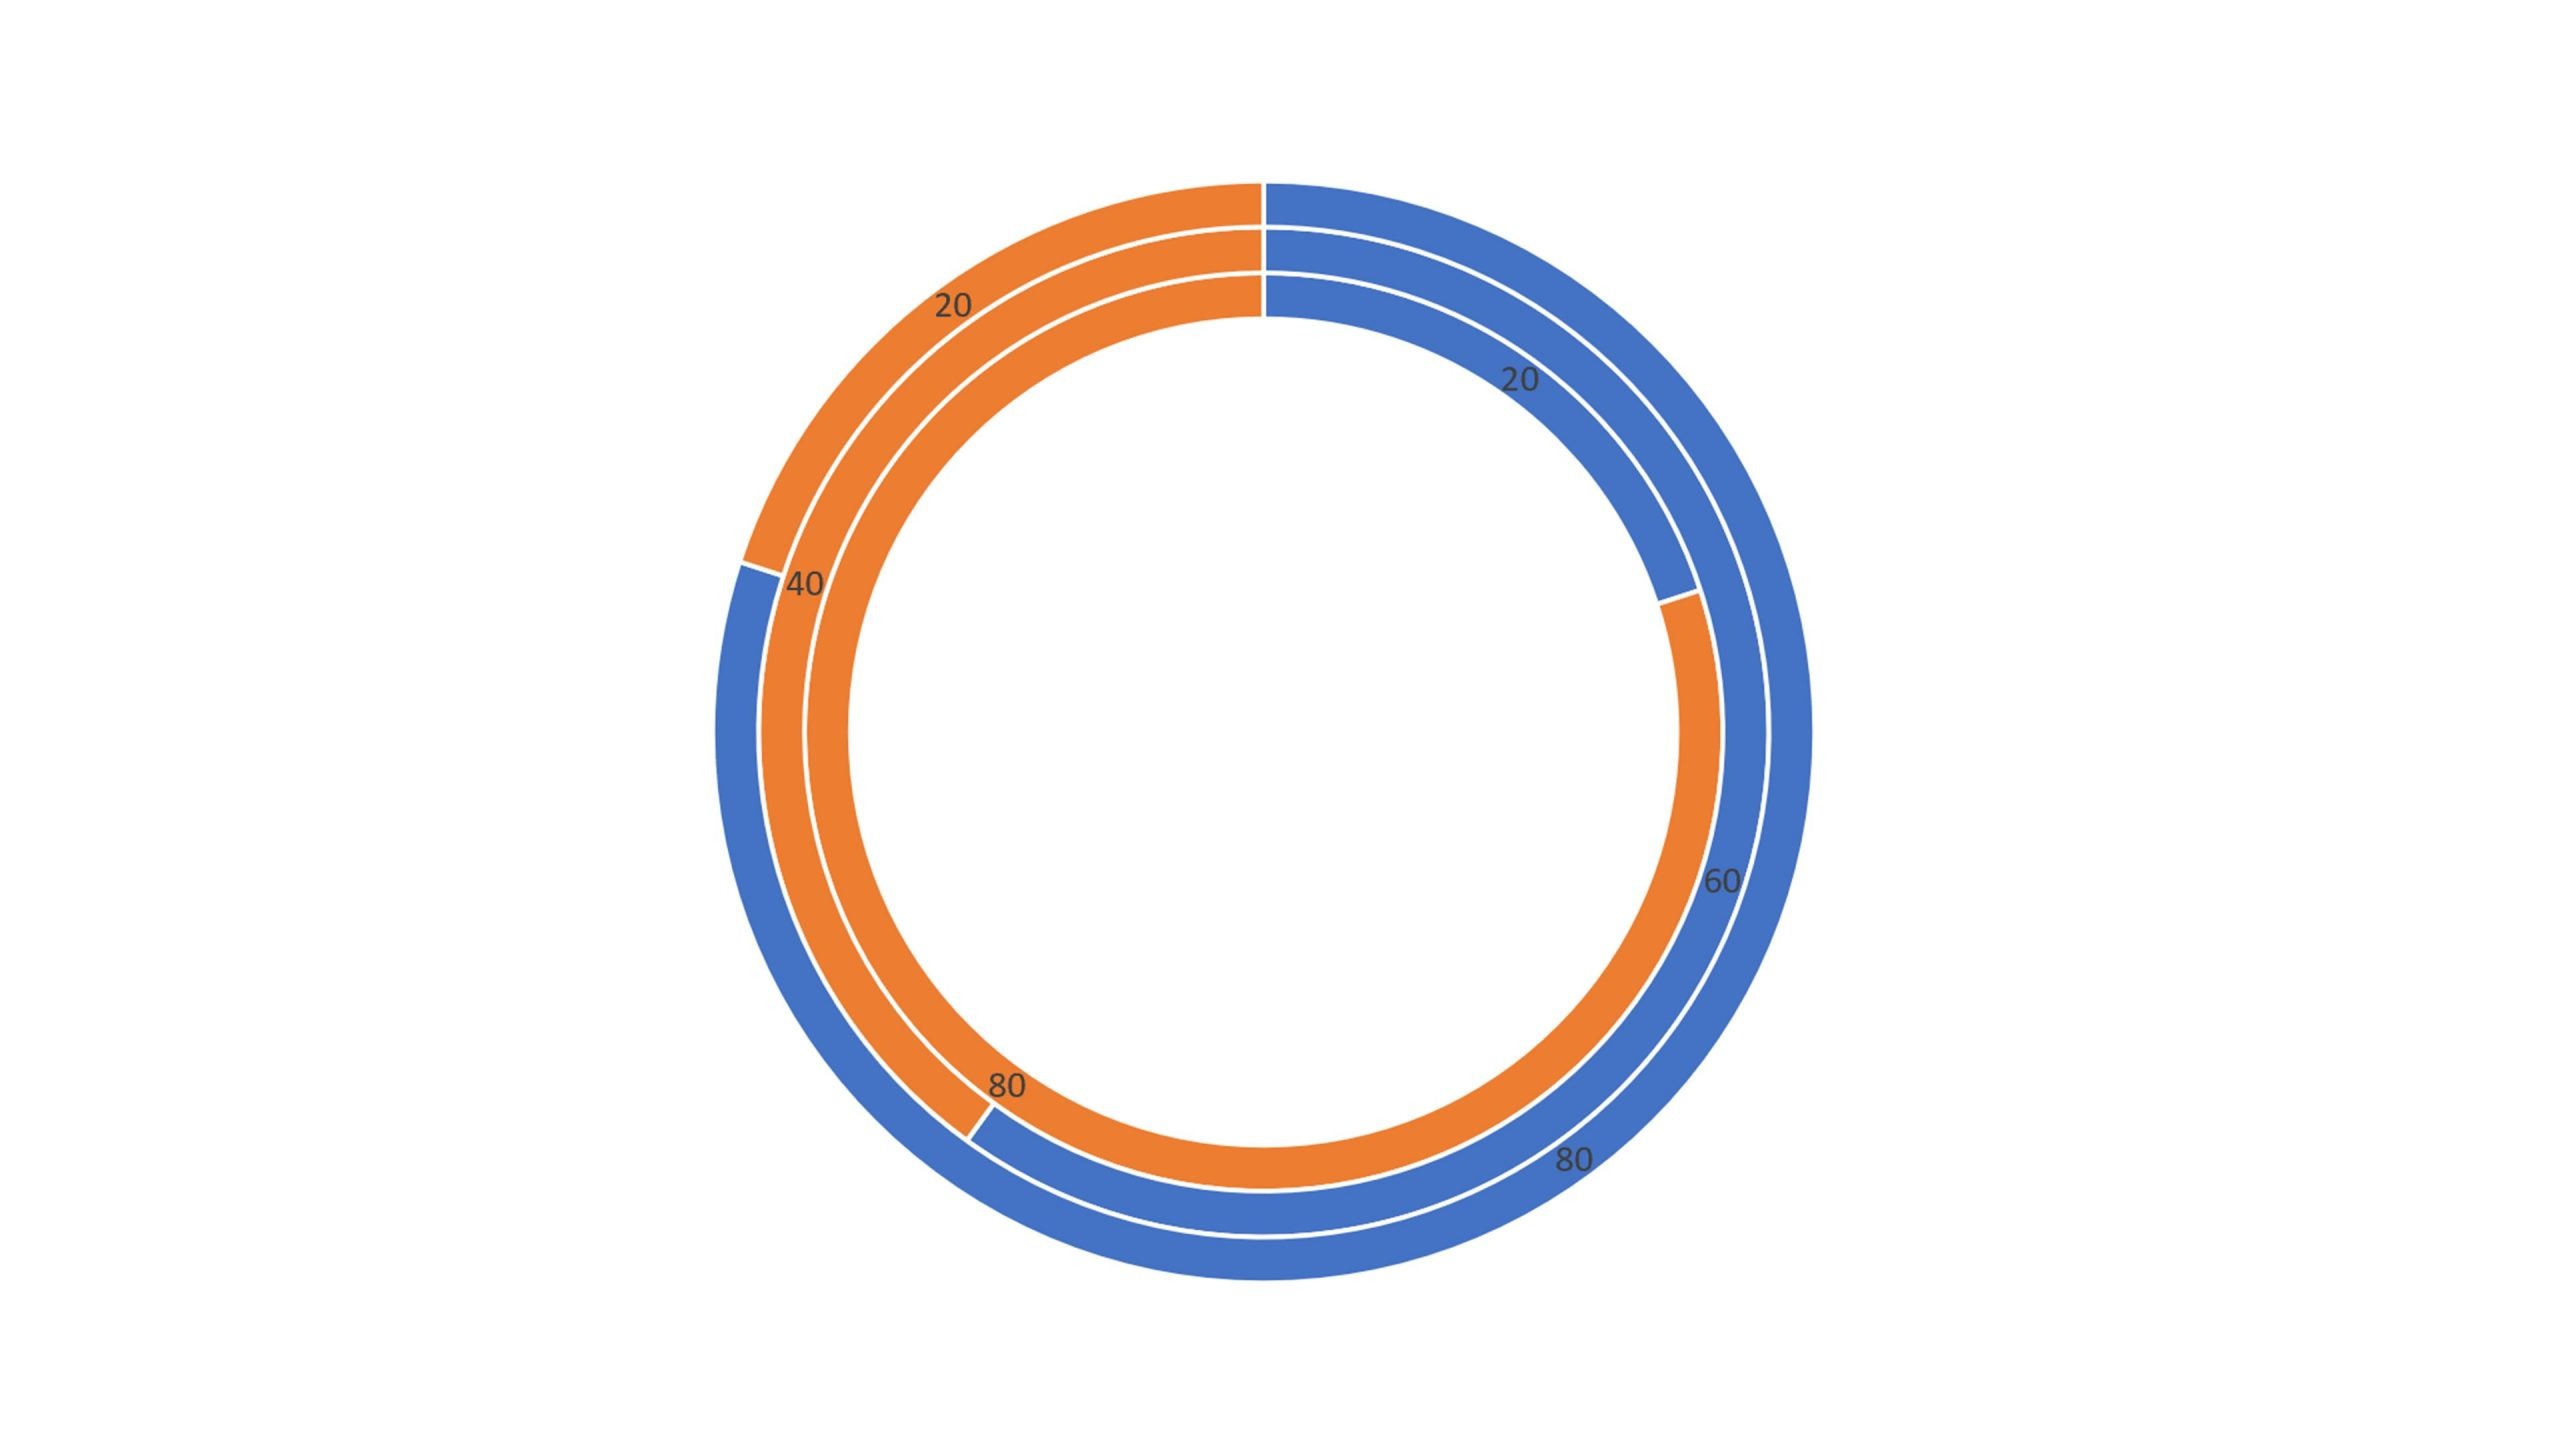
Of course, I need to present this data to the world! So, let’s head to PowerPoint, insert a live chart (Insert > Chart > Pie > Doughnut), and input the data.
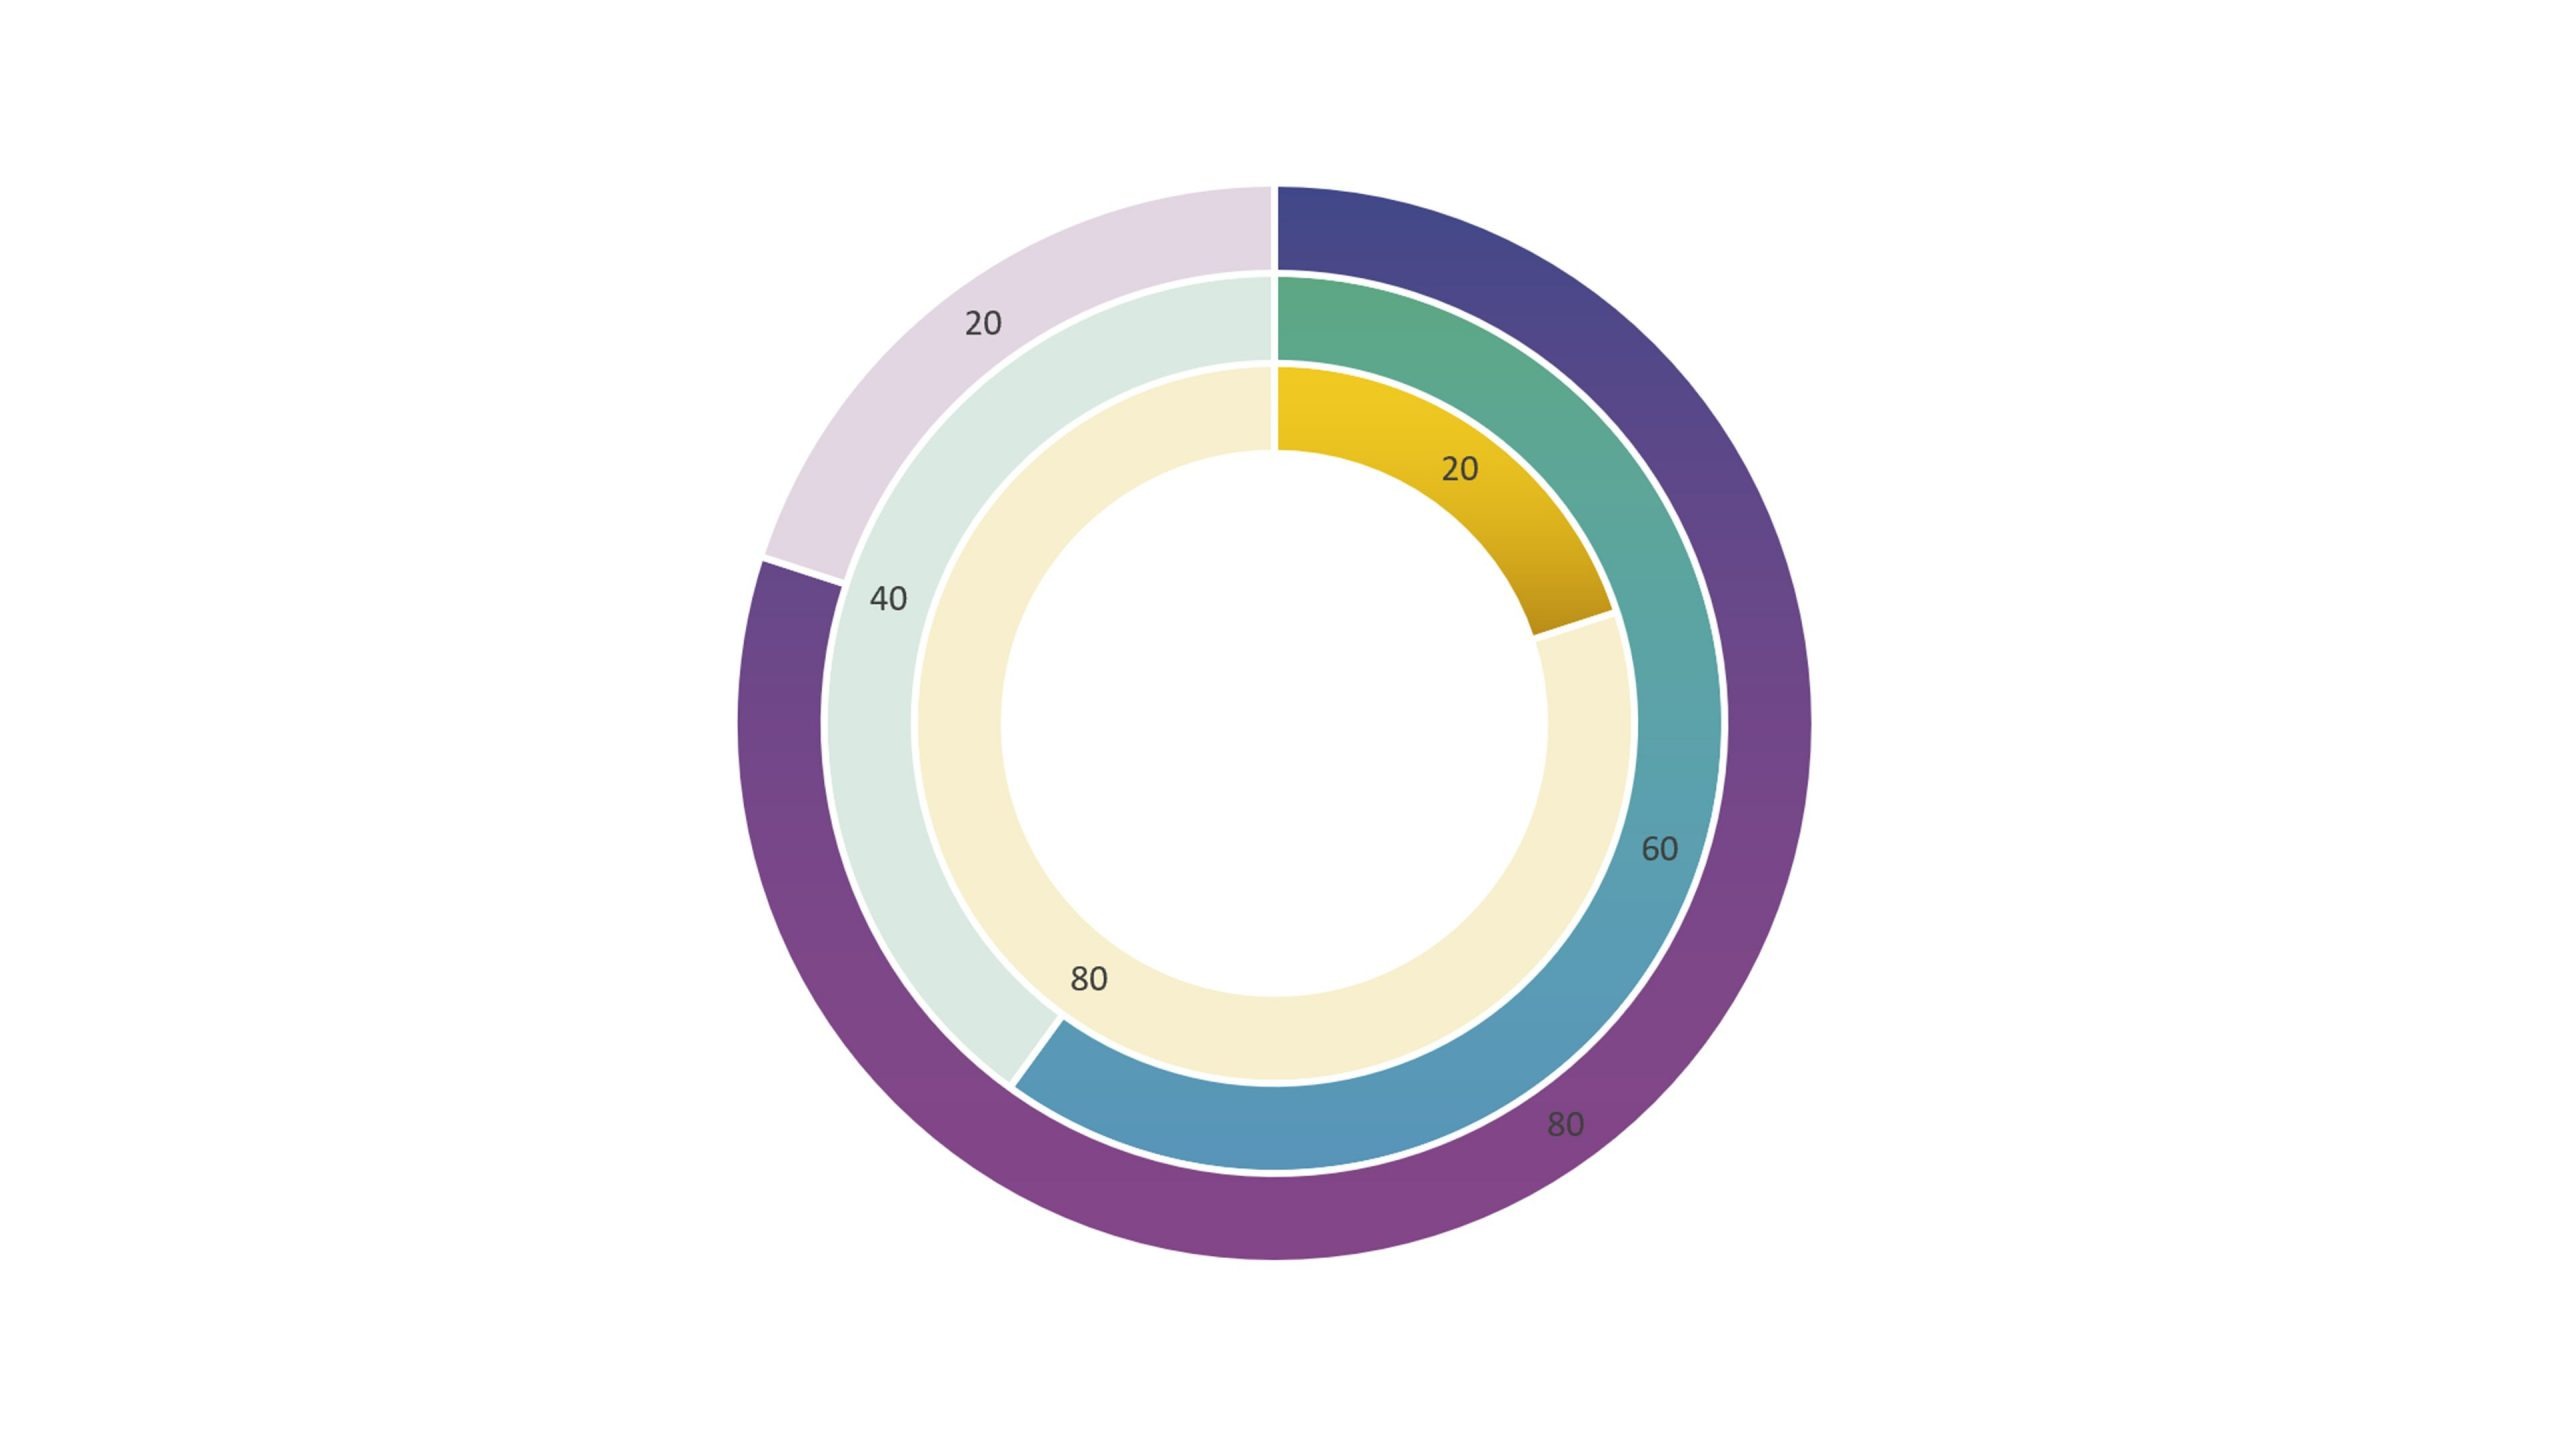
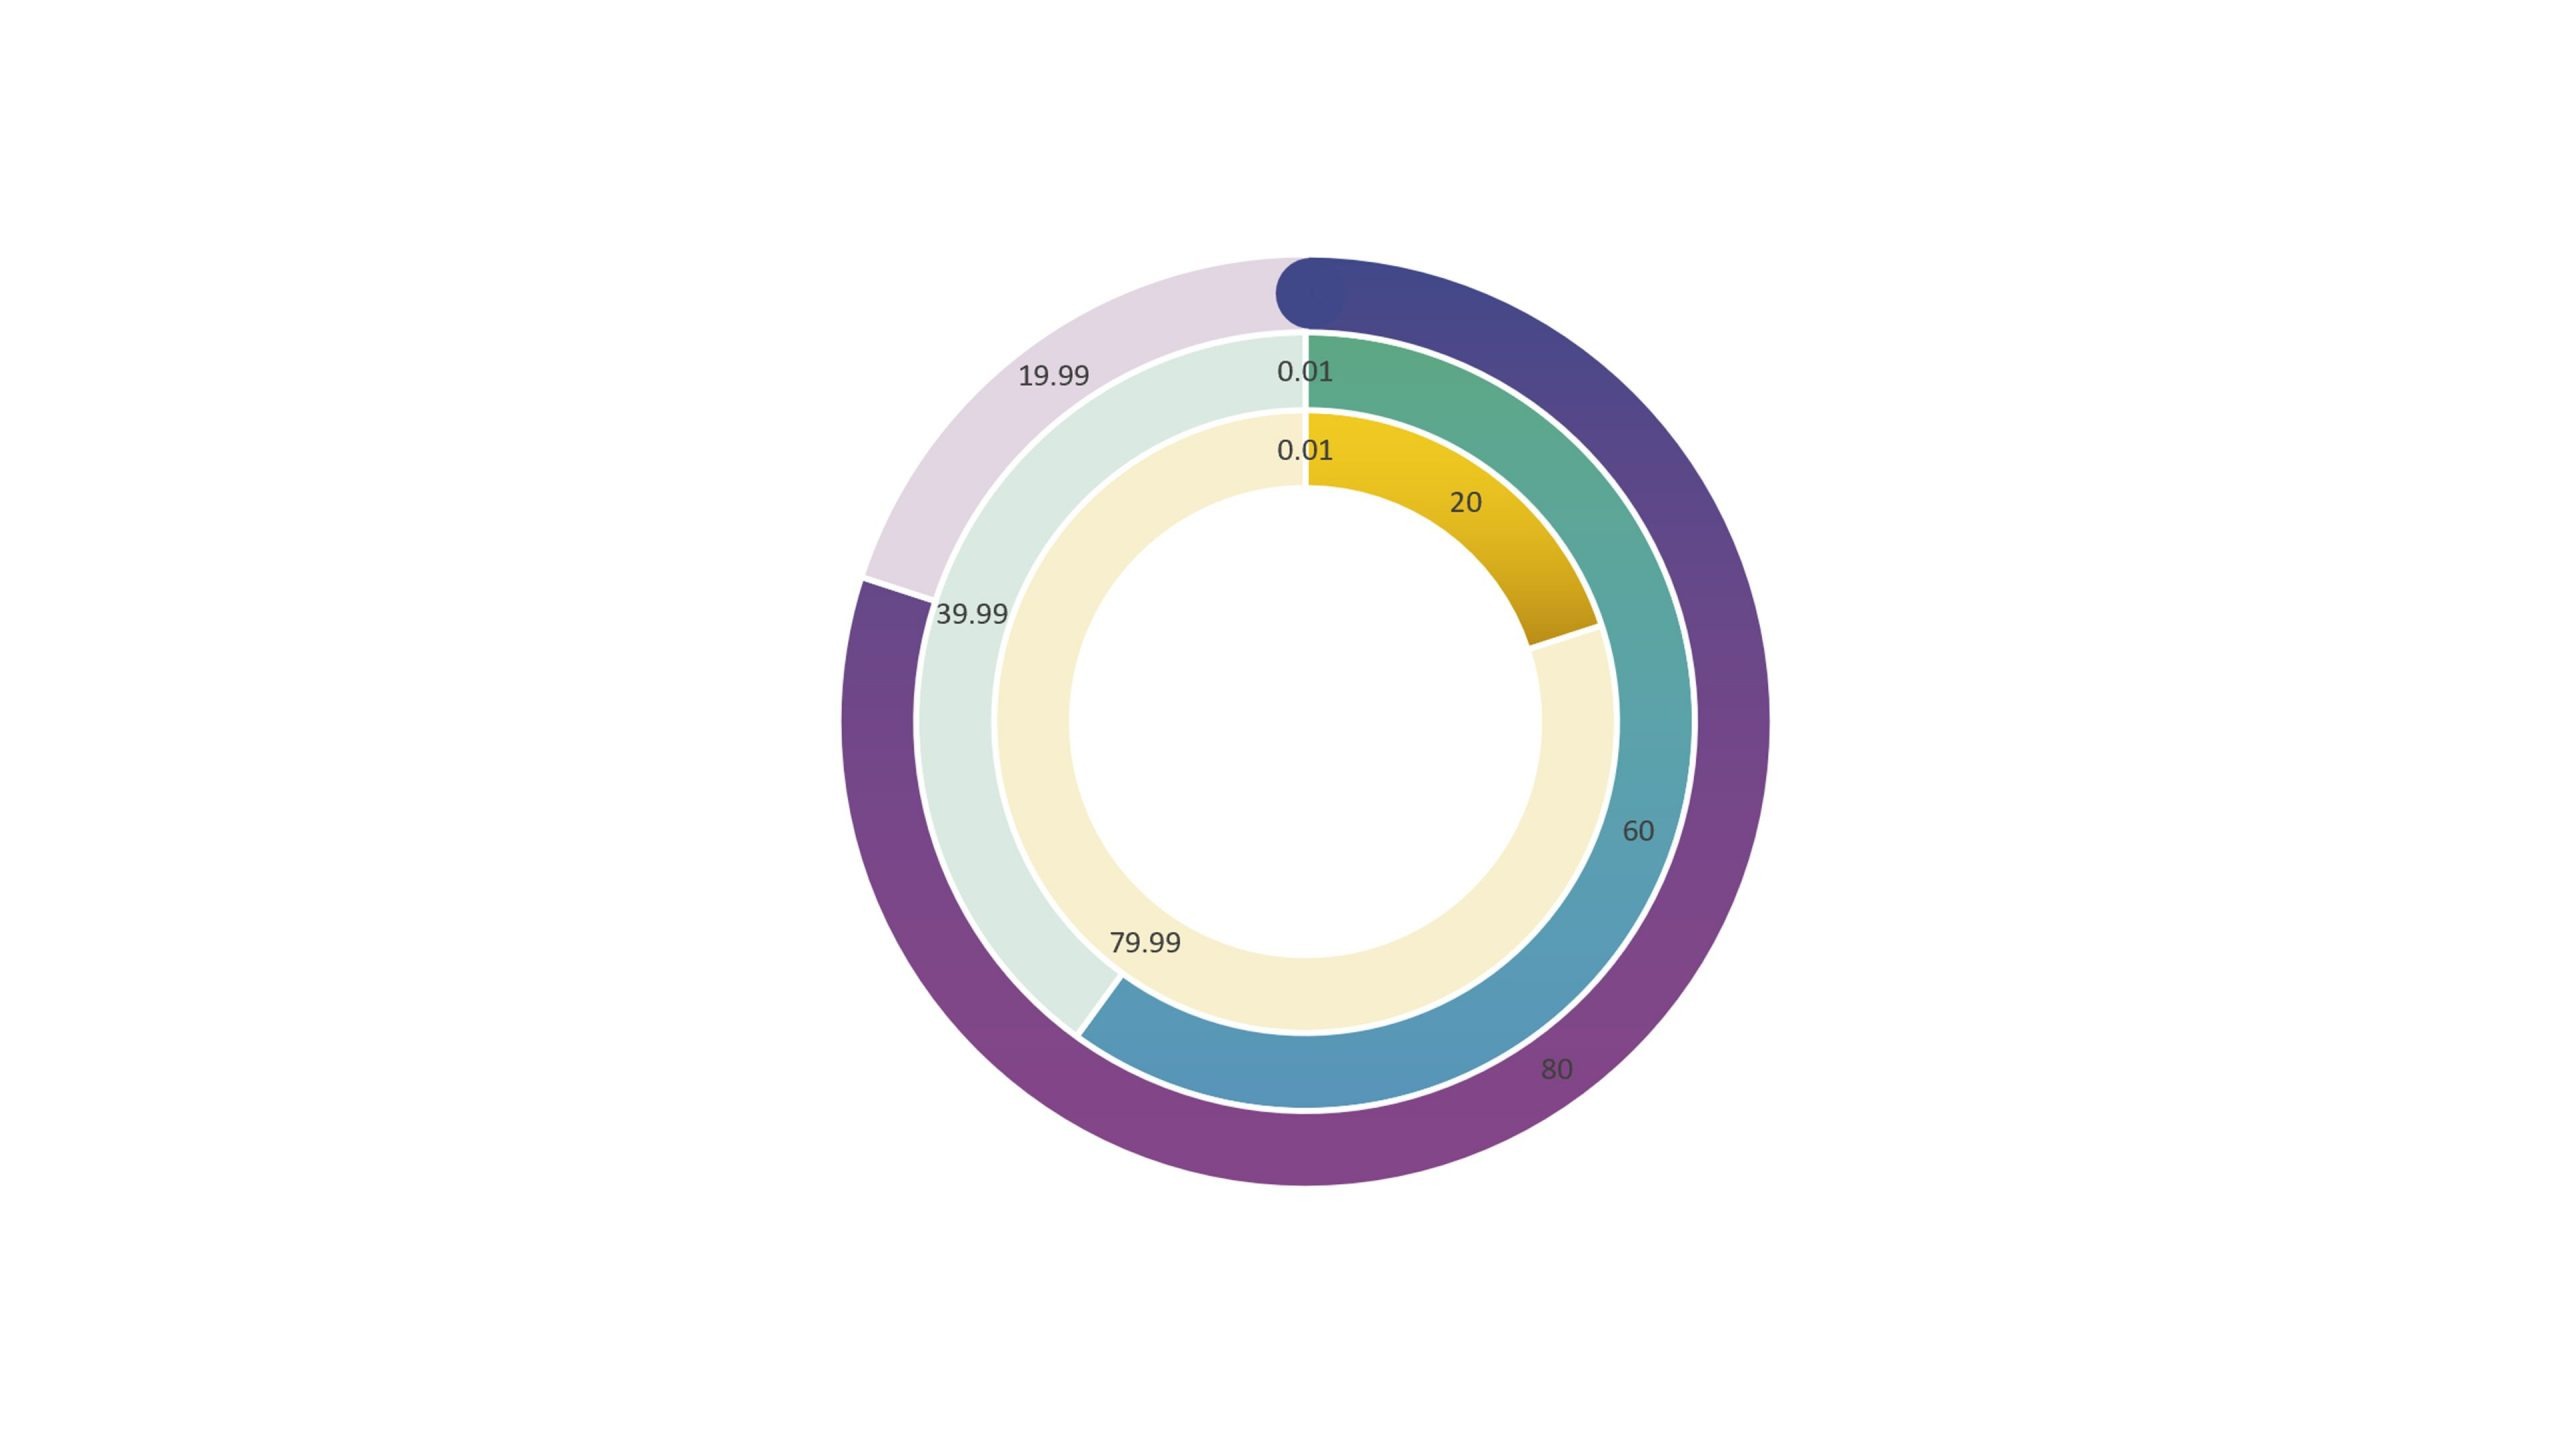
I’m going to start by getting rid of the standard graph colors and automatically generated layout. To make changes, right click on the chart then select FormatChartArea. Under Series Options you can adjust the size of the doughnut hole and, under Fill & Line, you can edit the colors/gradients of each segment. Then you can arrive at something like this:
Okay, it’s getting better! But I can still add plenty of creative spice. What if I told you that you could round the segment edges and include icons AND it would stay as a live chart? Let’s go!
To round the edge of the segments that start at 12 o’clock on your doughnut follow these steps:
Right click on your chart and select Edit Data
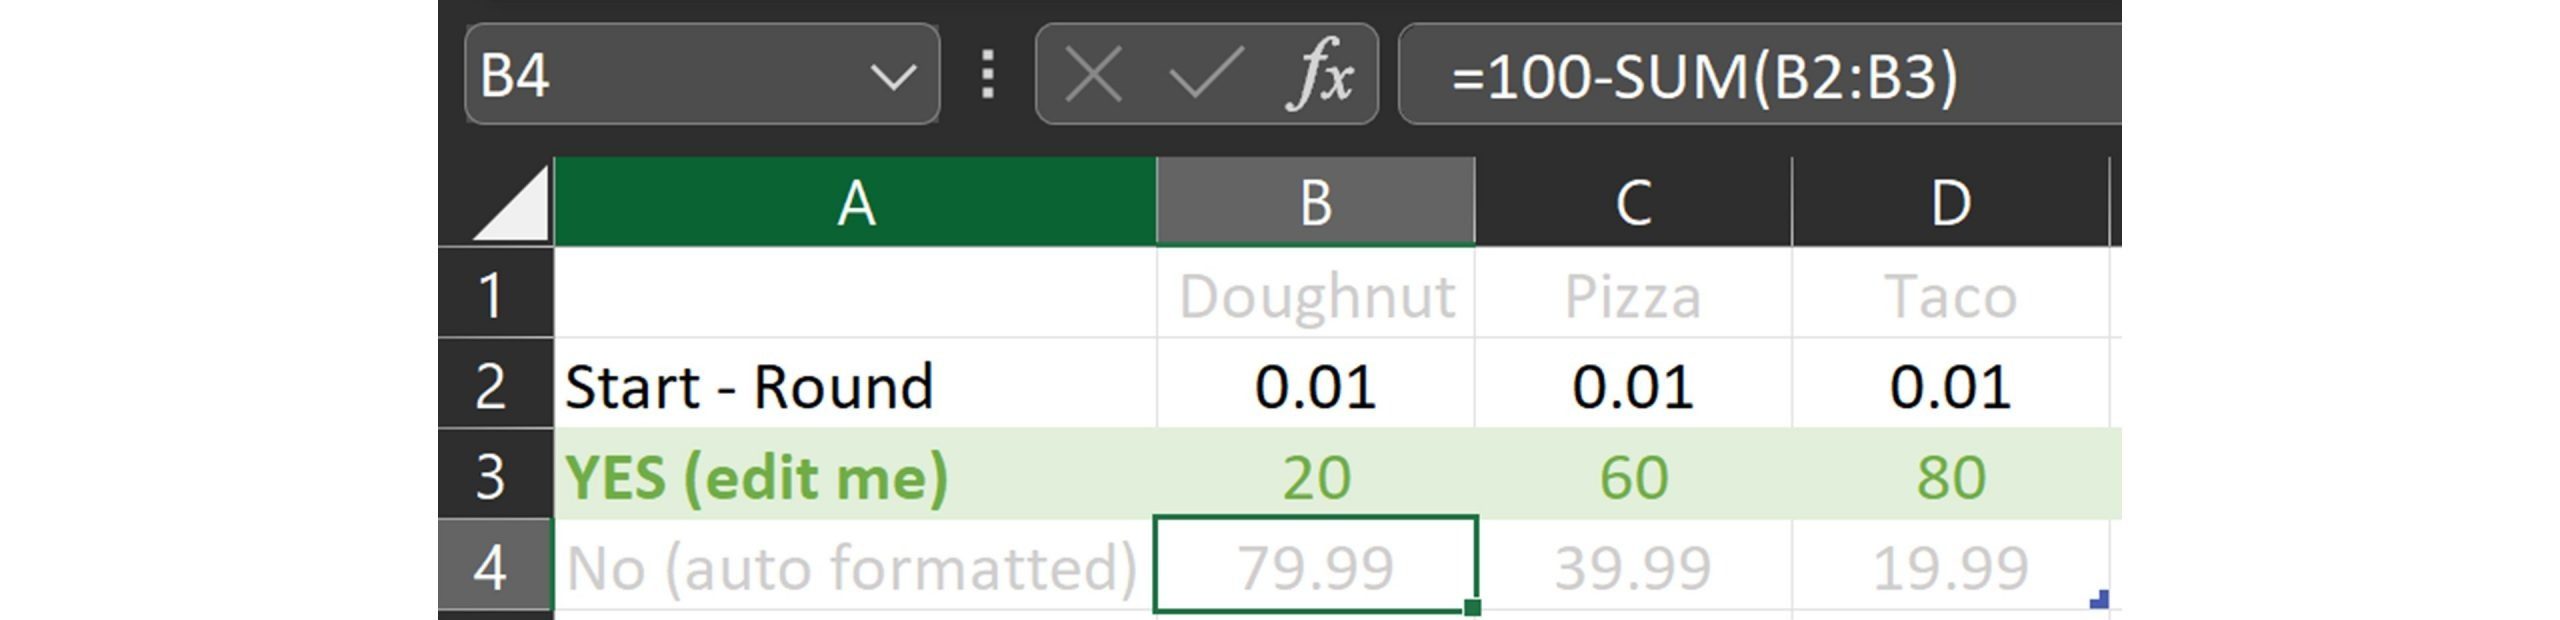
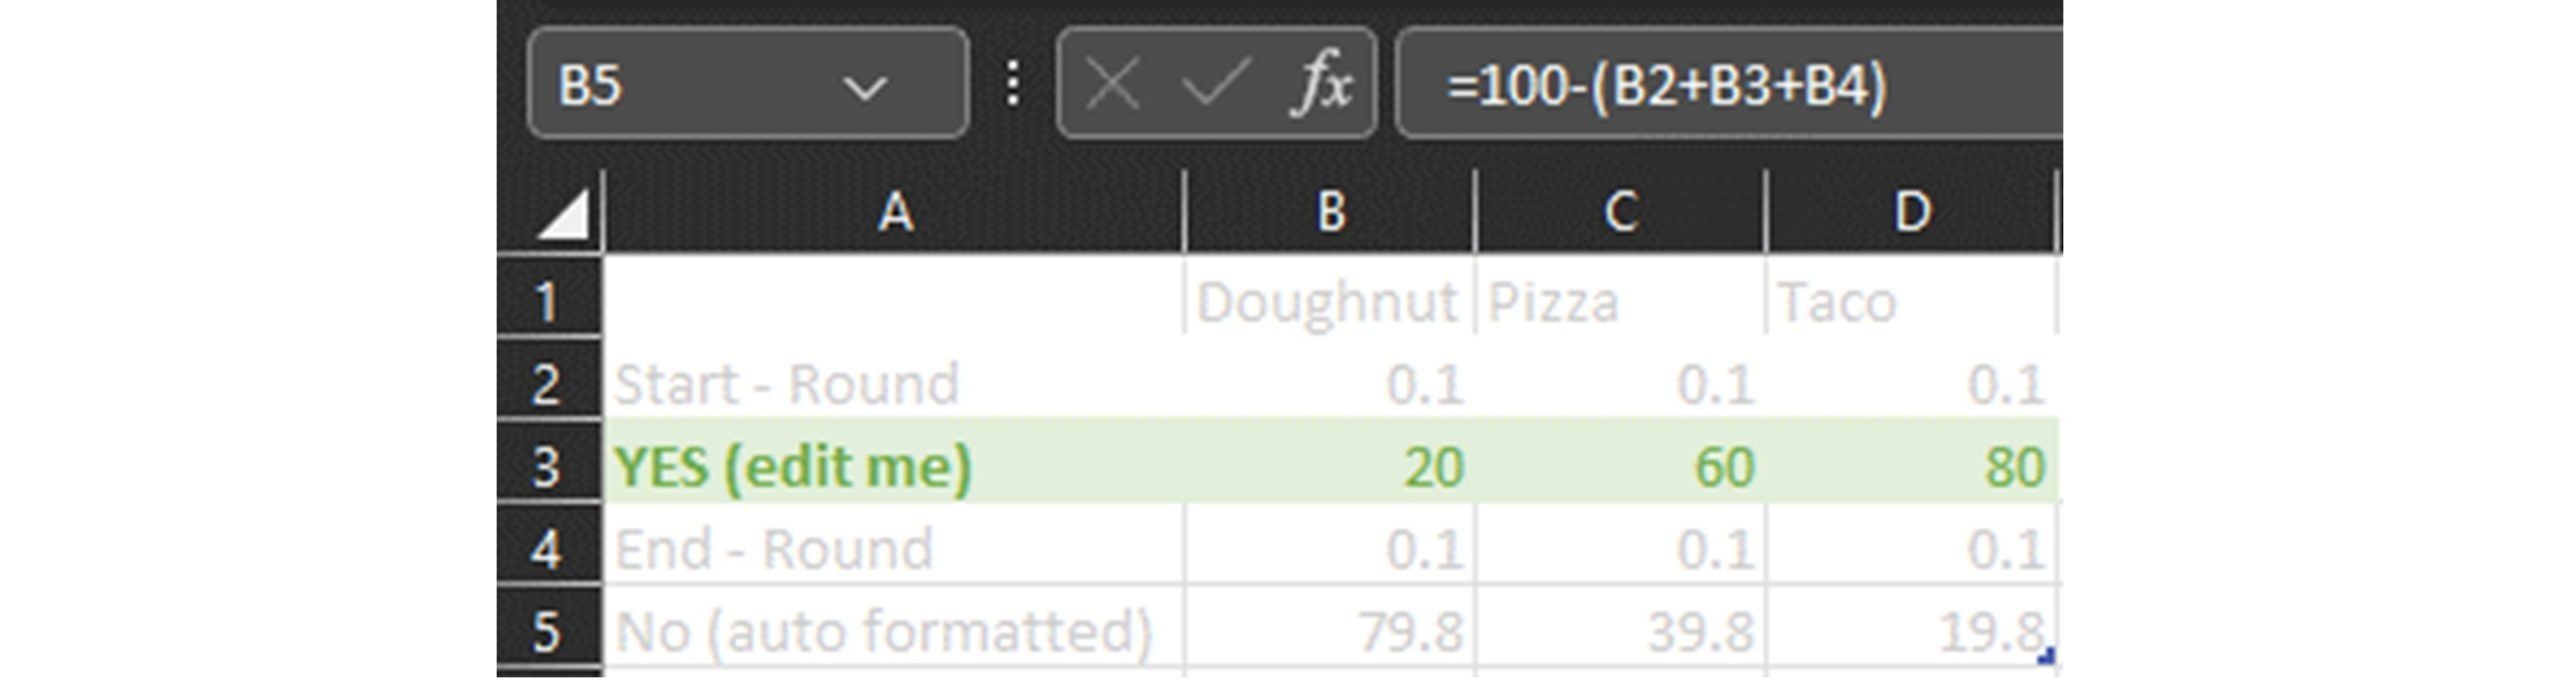
In the Excel sheet, add a row at the top and enter a value of 0.01 for each column. This row will allow us to round the segment, so I’ve called it ‘Start – Round’.
The row for the ‘yes’ responses is the only one you’ll edit when updating your data so name it something helpful like ‘YES (edit me)’
Where the ‘No’ response data is, we’re going to add a simple Excel formula in each cell which subtracts the sum of the previous two values from 100 to autogenerate the ‘No’ value. In the example below you can see the formula is =100-SUM(B2:B3).
Close the Excel sheet.
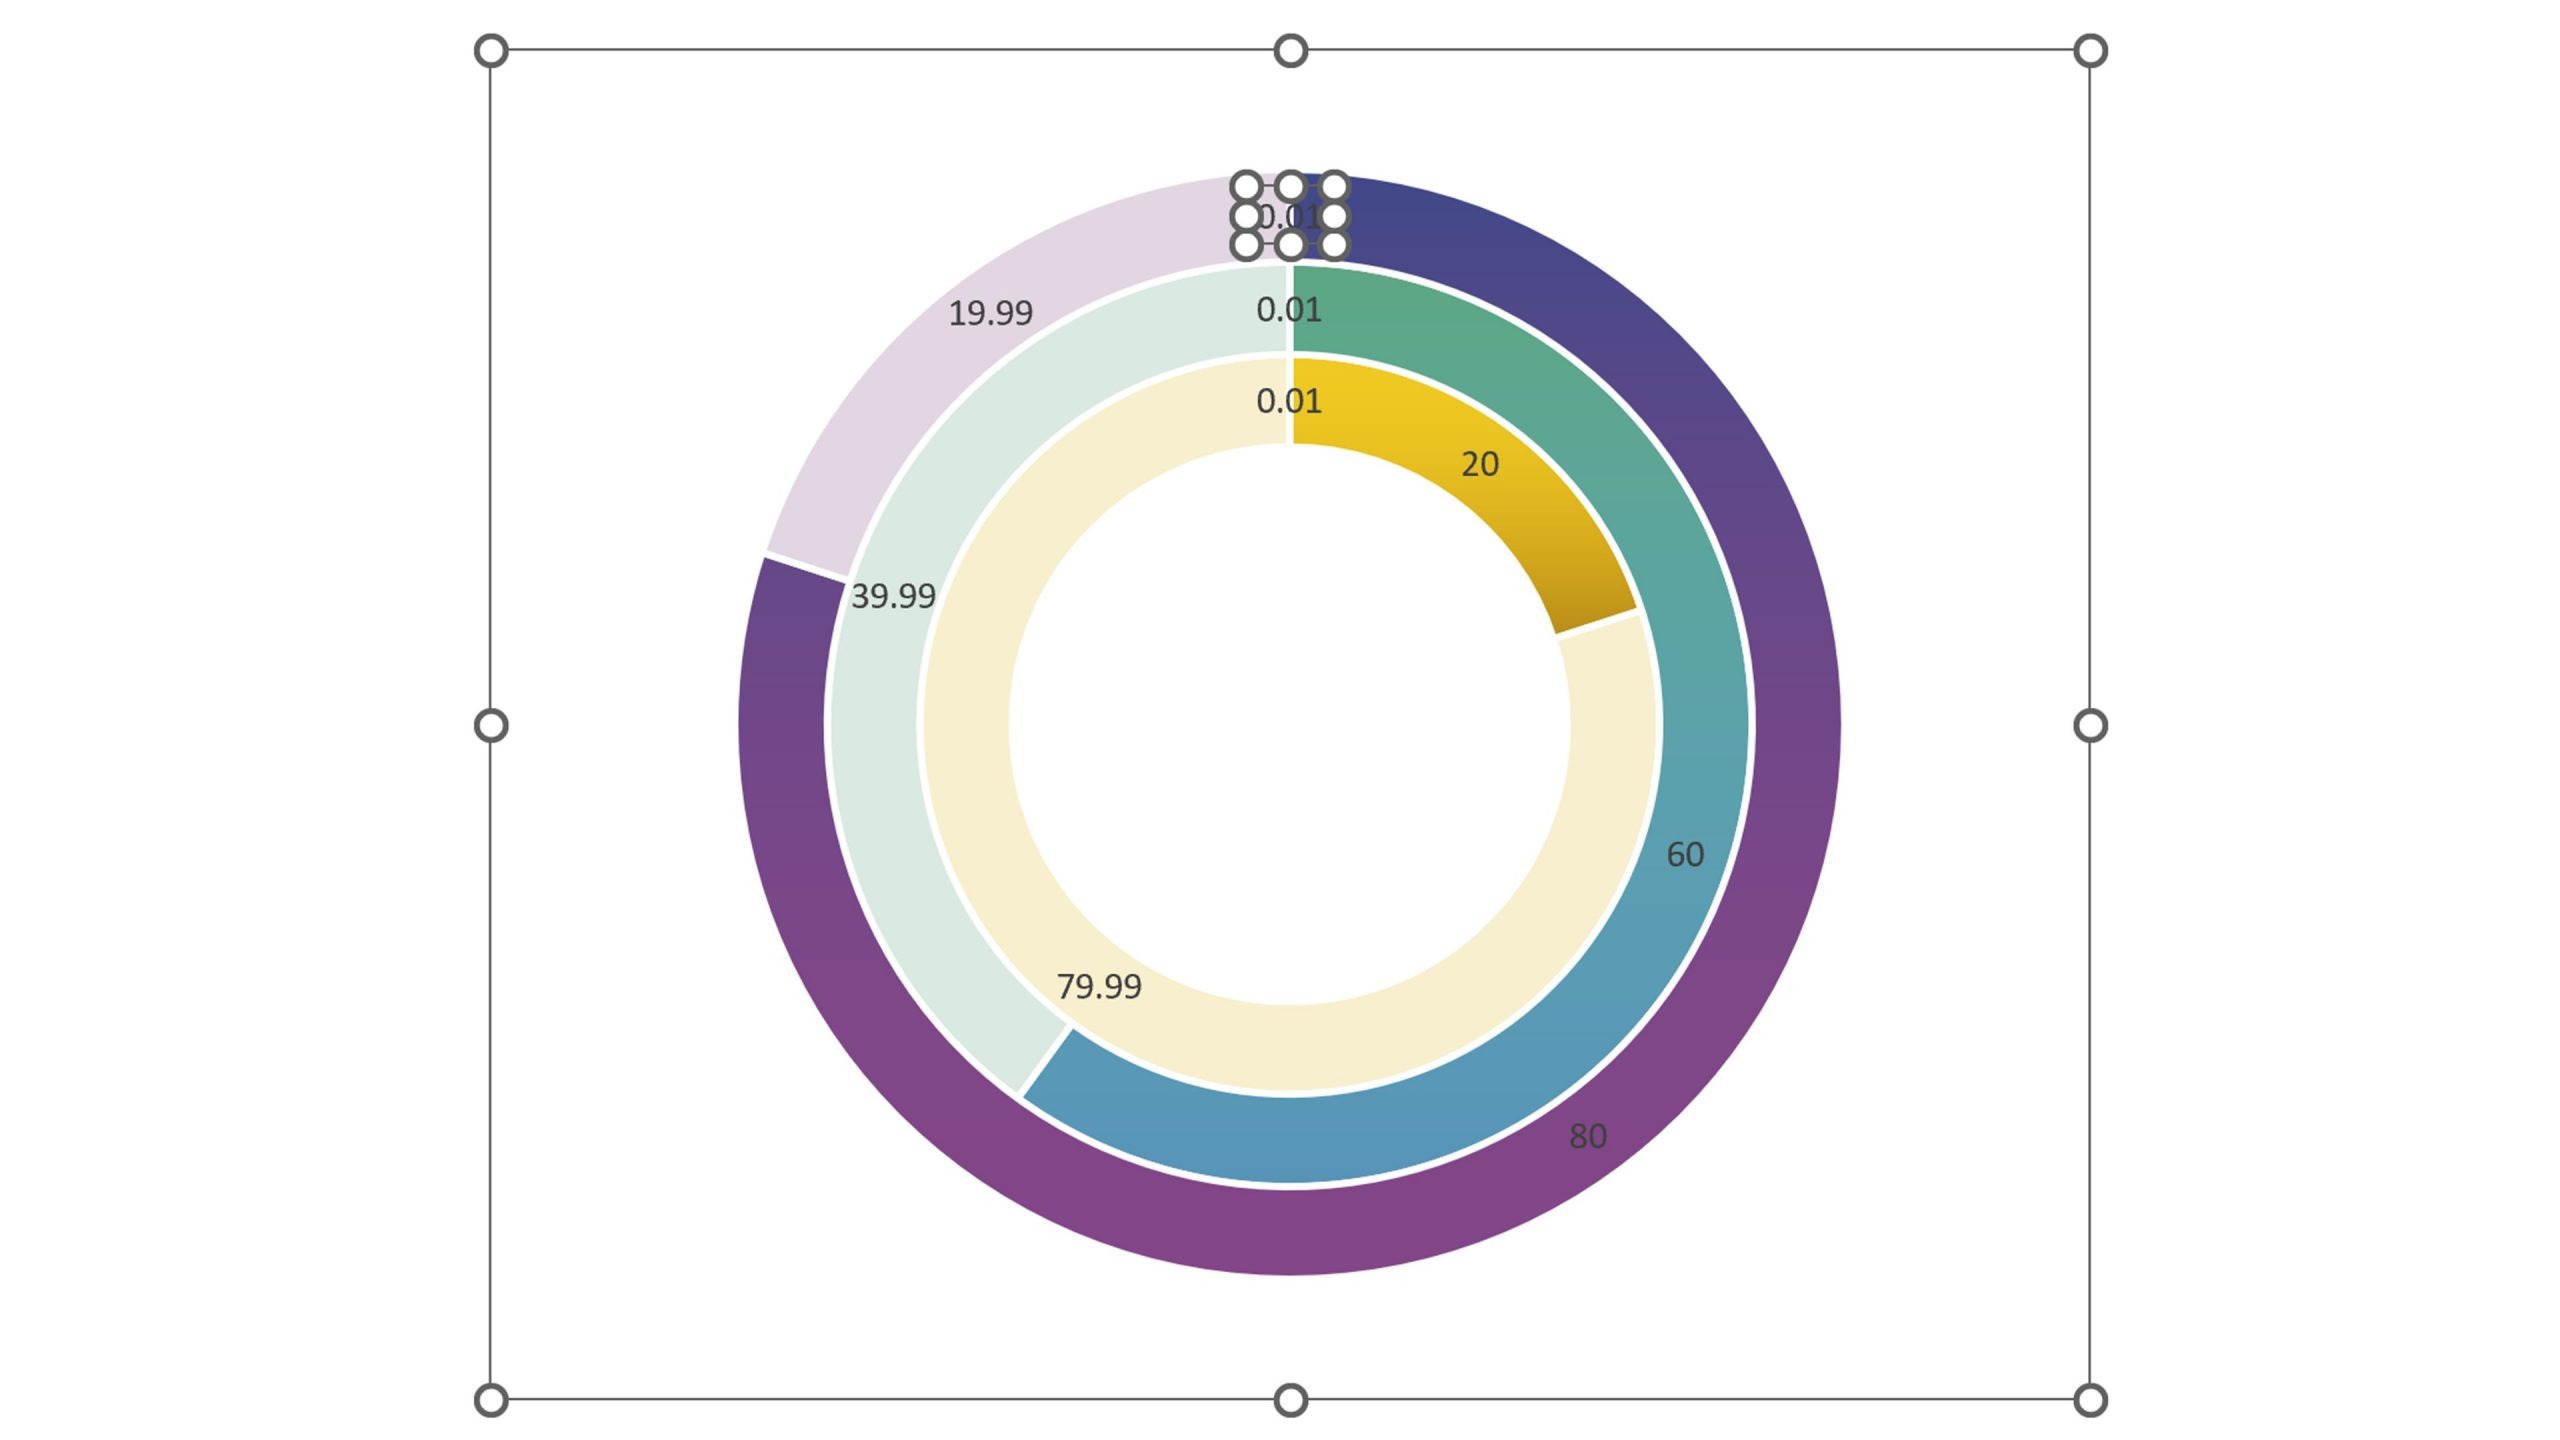
Once you’ve created this additional segment, you can manipulate its formatting for a creative design that’s still editable.
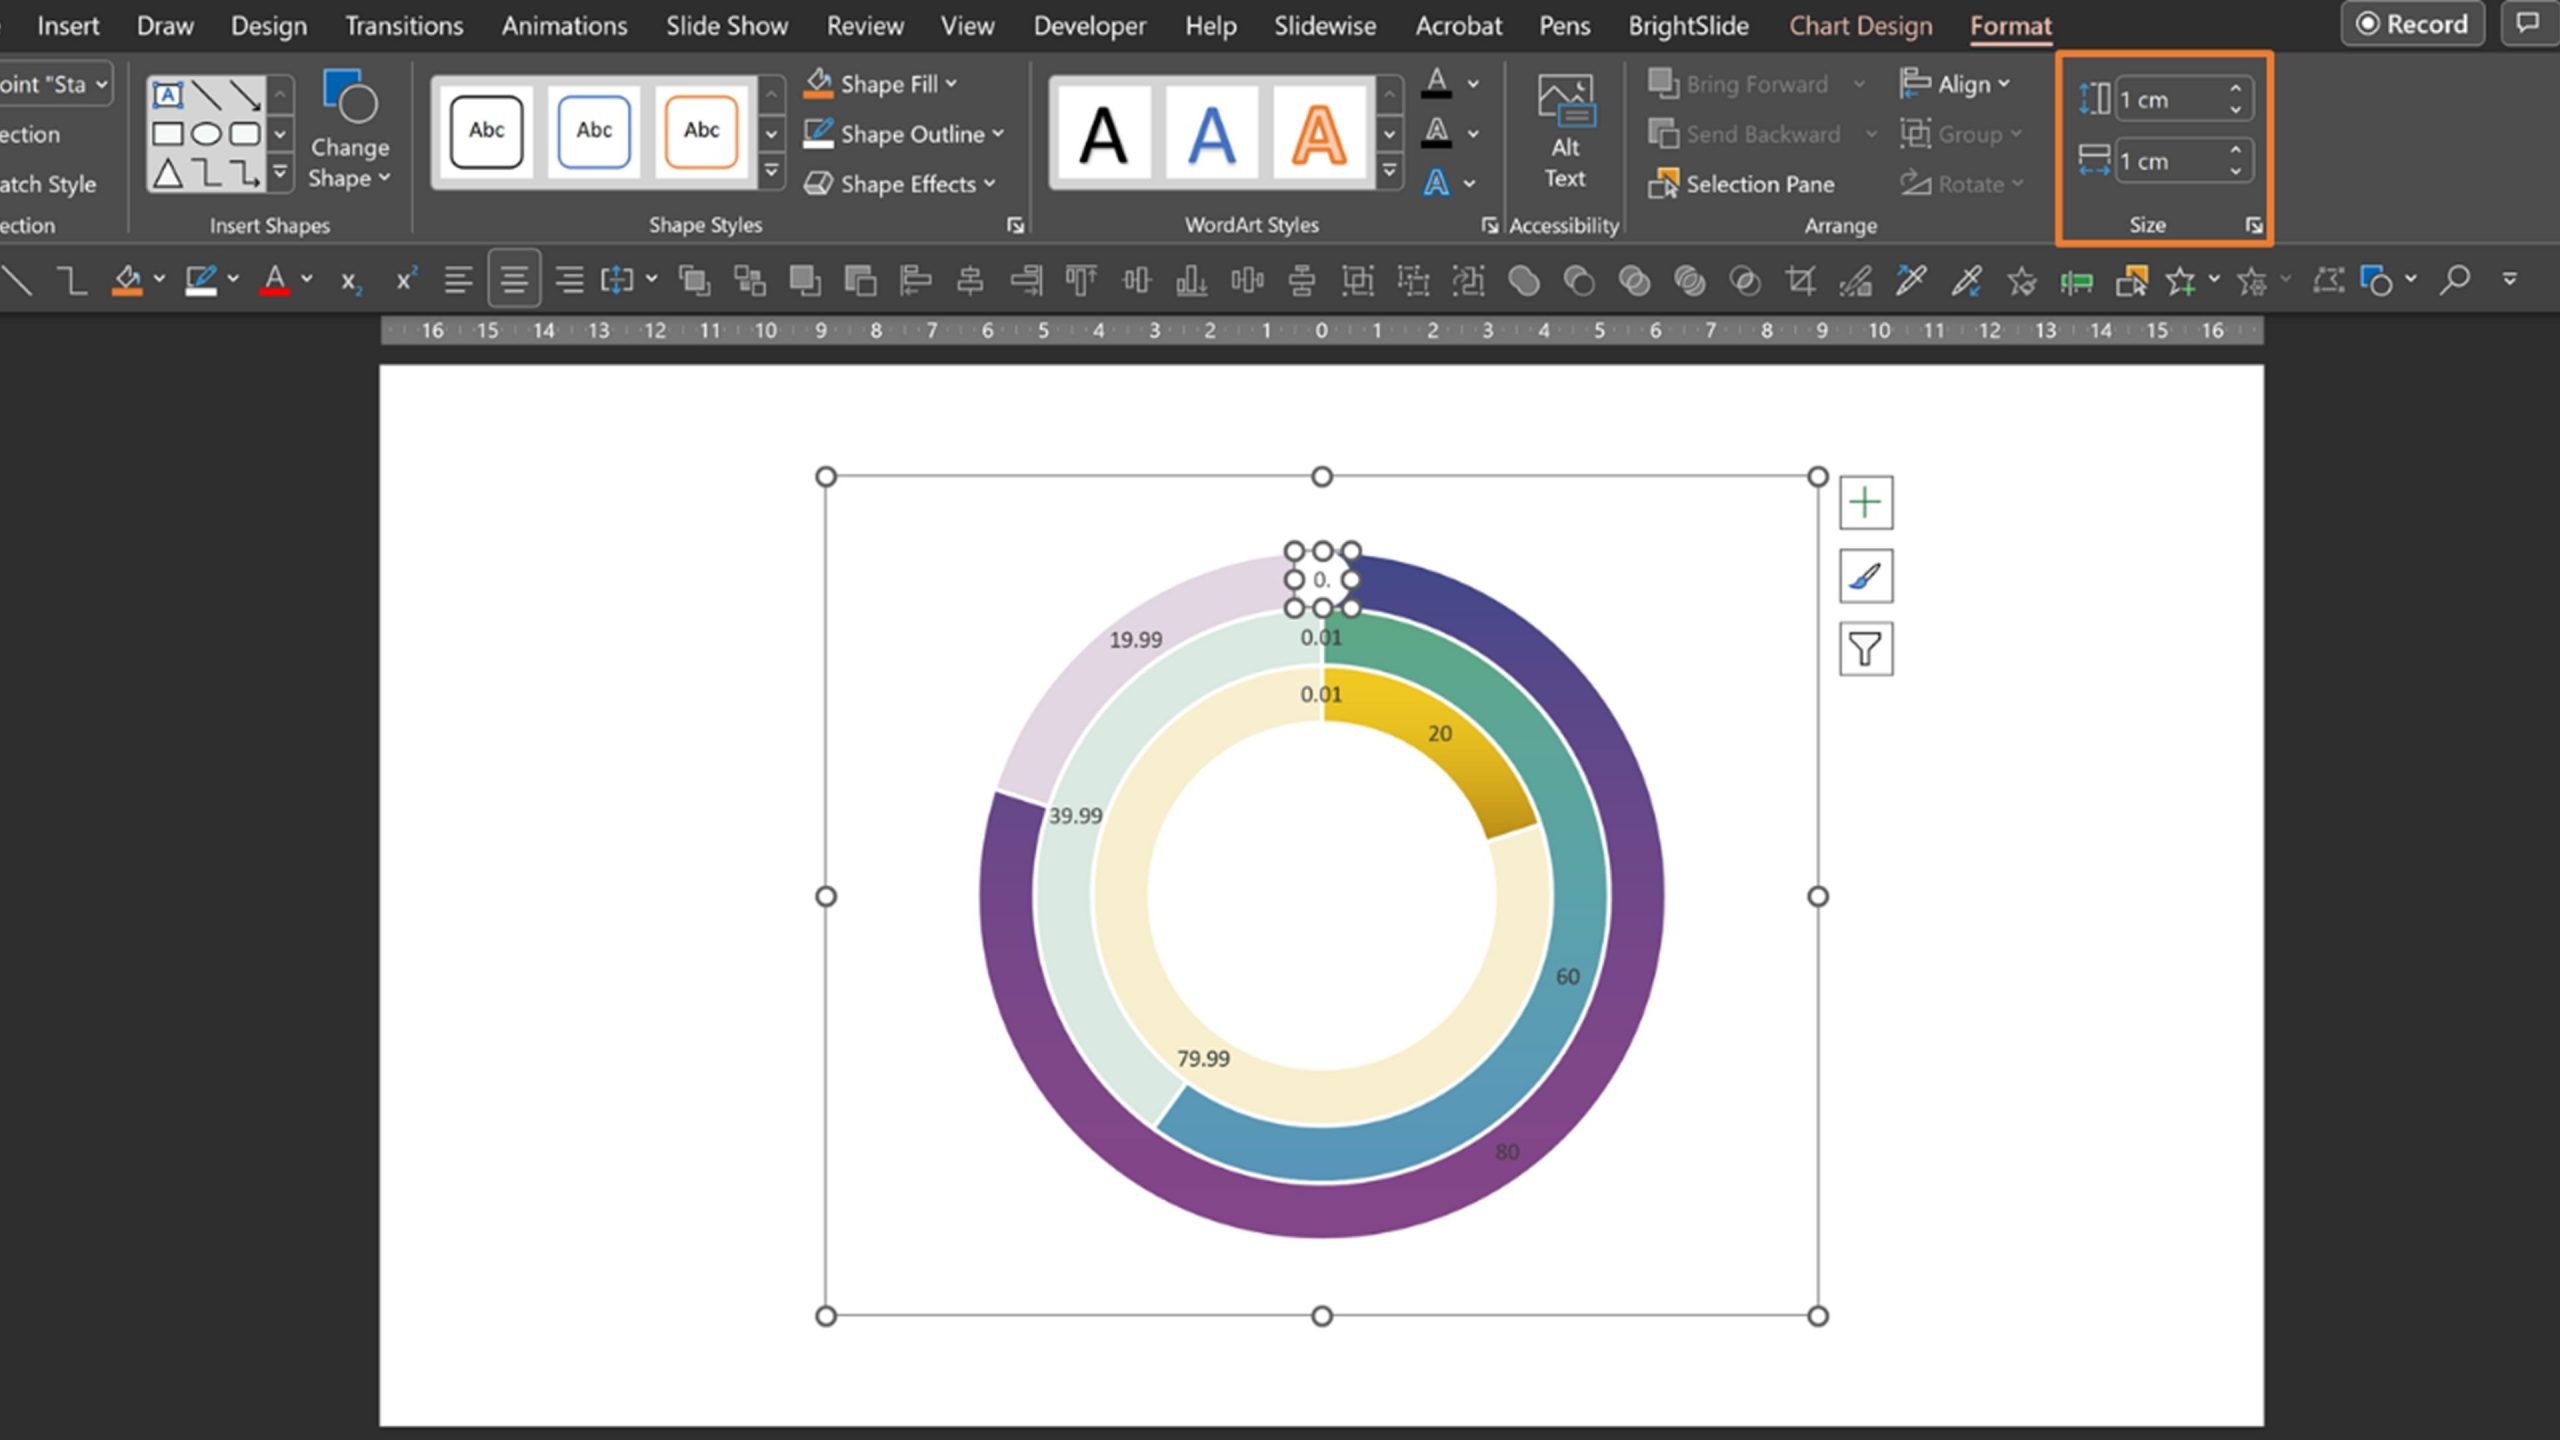
First, select the 0.01 data label. Then, navigate to the Format tab, under InsertShapes select ChangeShape and select the oval.
Your data label should now be an oval. Under Size, edit the height so it matches the height of the doughnut segments. You can find out the height of the segments by selecting a segment, going to Format and looking under Size. Then, edit the width of the oval so it matches, making the shape a circle.
Then edit the fill, outline, and font color of the circle to match the next segment so the circle blends in. You may need to reposition the oval, so it lines up with the segment. It should look something like this:
You can follow the same process on the next rings of your chart, creating a natural, modern design and breaking the mold of the default PowerPoint styling.
Once you’ve done this for all of the segments, you can add a fourth category on the third row of your chart (as before with the value ‘0.01’) to each segment and amend your ‘No’ formula to include the extra cell. This will add a new data point you can manipulate at the end of the ‘yes’ sections.
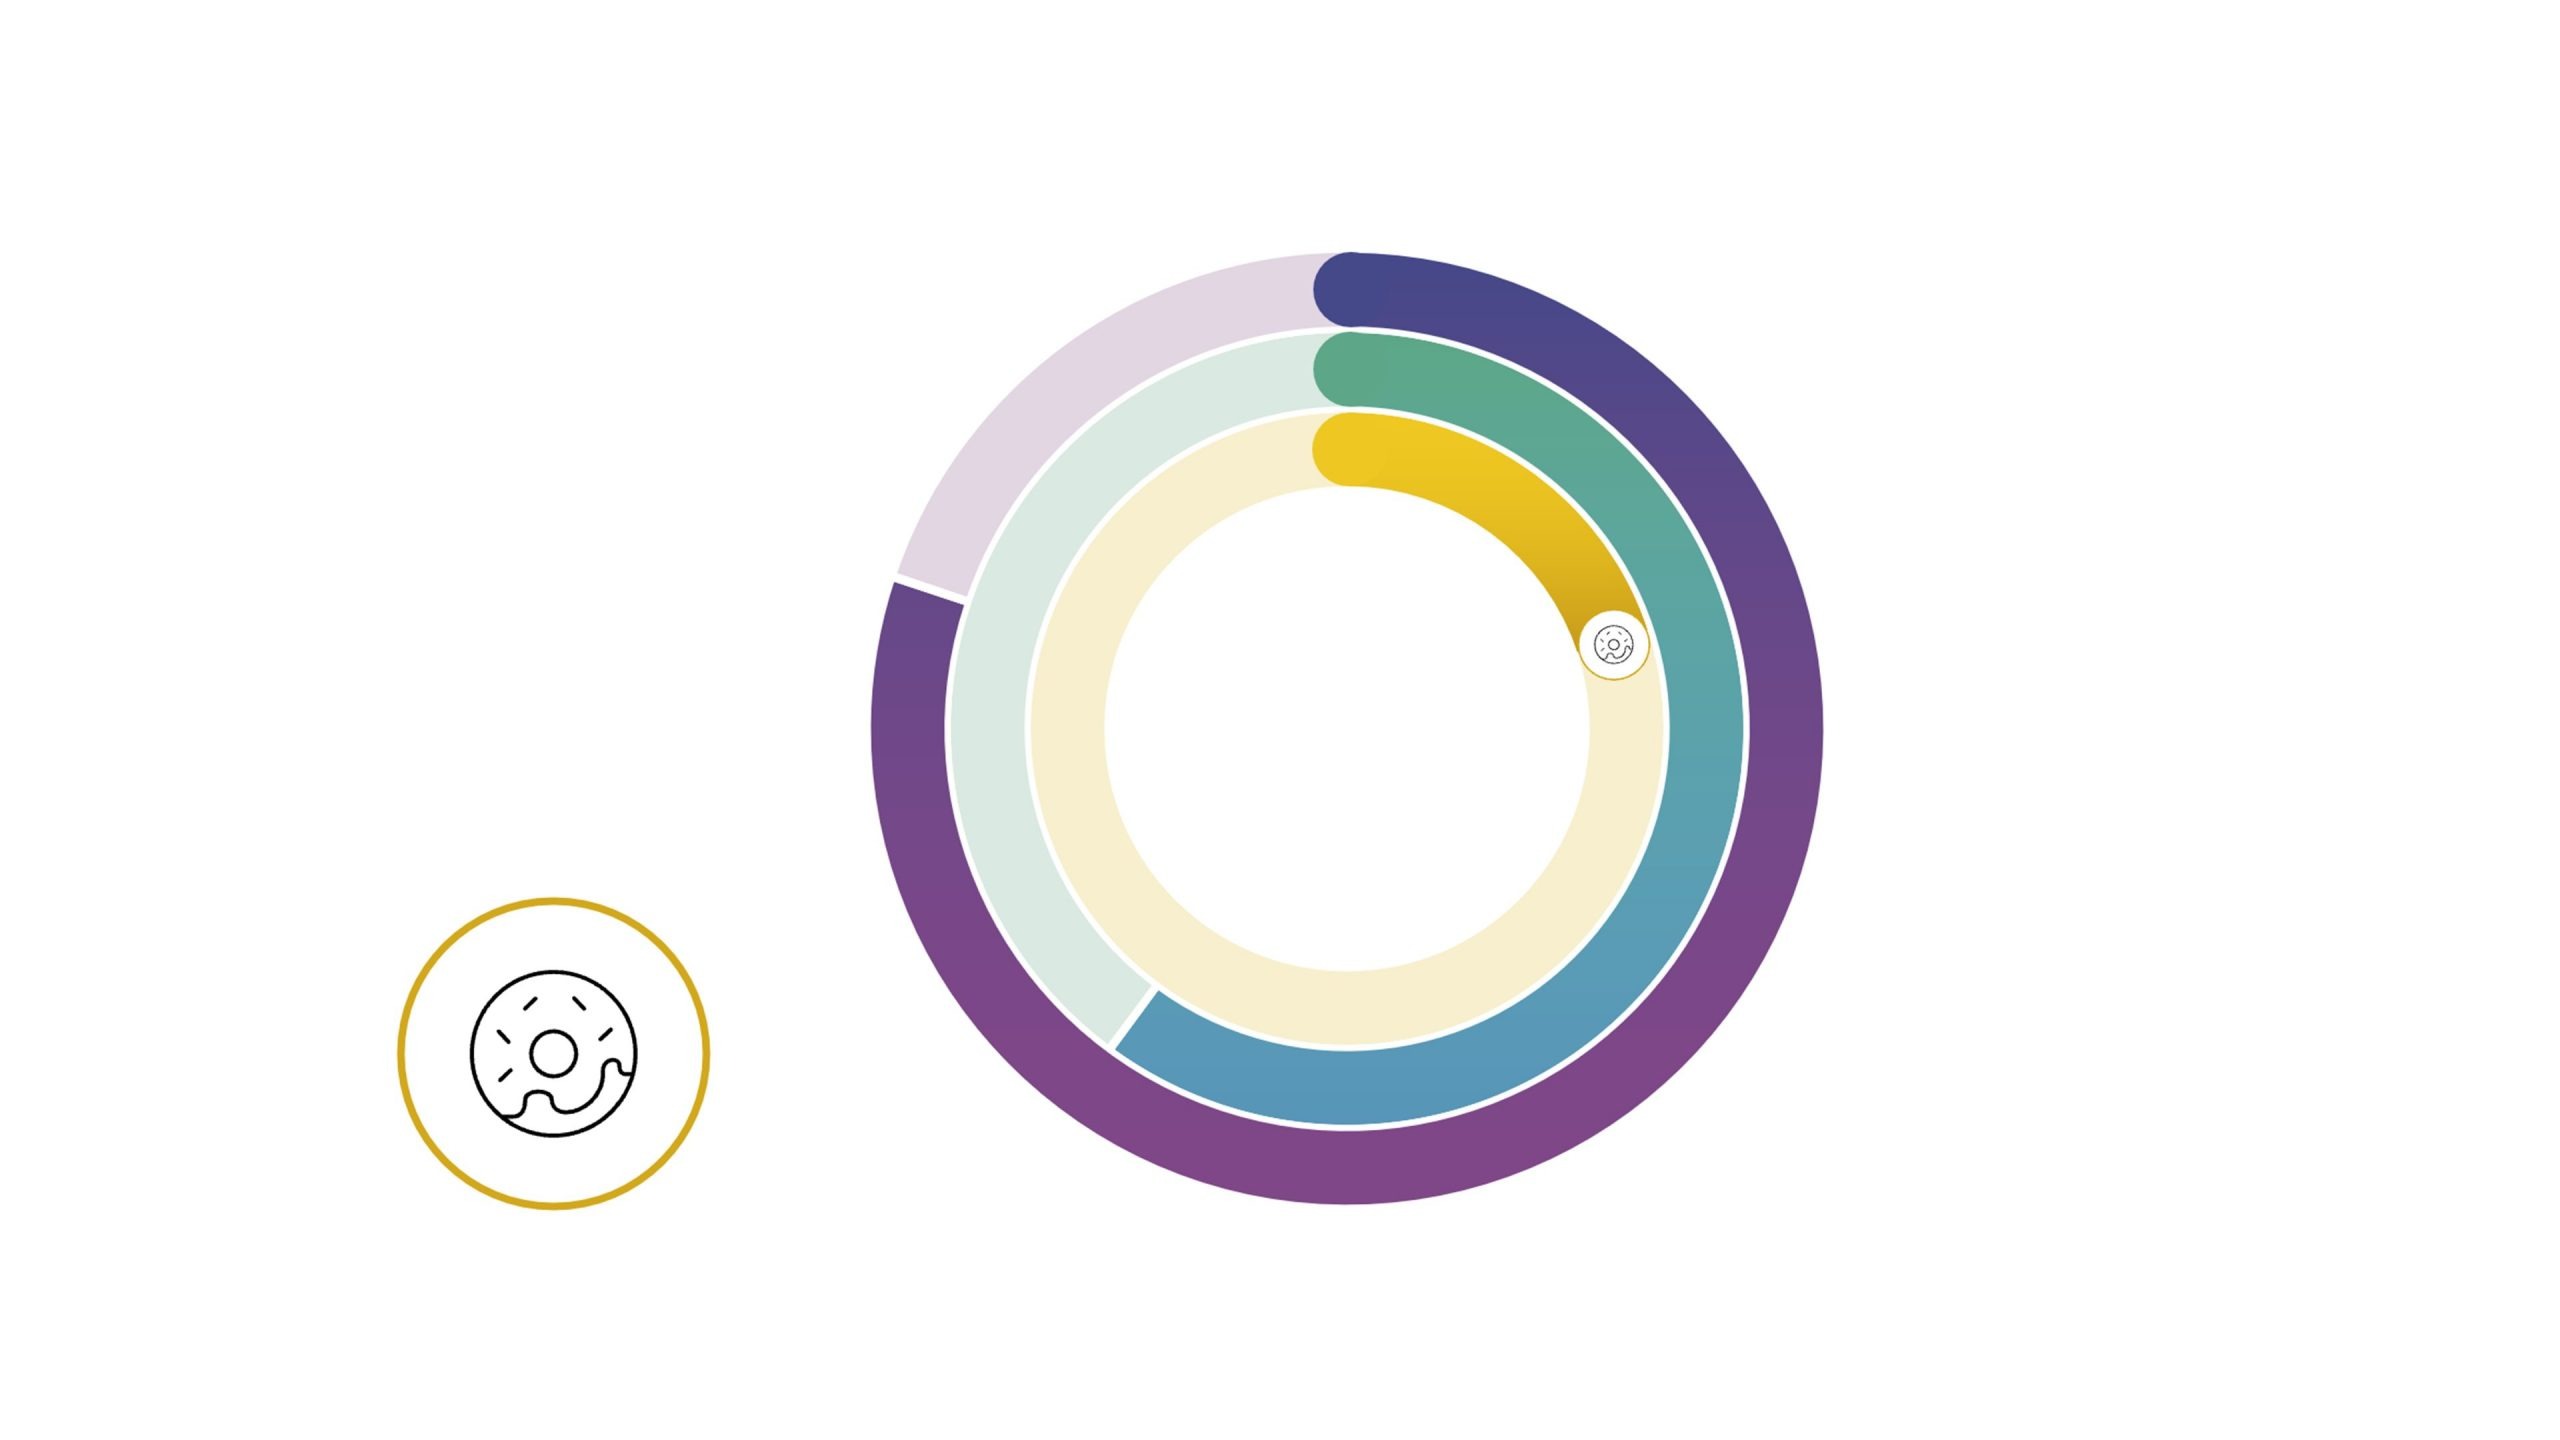
Let’s add an icon here to represent each food category. First, create the icon you’d like to pop at the end of each segment. I simply inserted a circle with a white fill and outline that matches the relevant segment. I then grabbed a doughnut icon from the PowerPoint icons (if you want something special, check out this blog post on creating custom icons), and popped it in the center of the circle then grouped the two objects. Once done, copy the group, select your new 0.01 data point, then right click and select FormatDataLabel > Fill&Line > Picture or texture fill > Clipboard. (Depending on your graph sizing you may have to resize the icons, to even the horizontal and vertical sizing and make it a true circle, and possibly reposition the icon into the correct place.)
Doing this to all three segments will allow you to transform a plain old sugar doughnut into a wonderous, icing covered, exotically flavored, sprinkled doughnut. And, as the changes have been made to data points in the chart, the icons will react to any data updates and allow the chart to remain ‘live’.
This ‘out of the box’ thinking and theory can be applied to lots of different auto charts in PowerPoint to help you showcase your data in a more creative way. Create the best chart (or sandwich) you can, and show it off to all your friends. Just don’t forget the hot sauce!
We’ve been investigating what gets lost in translation when you open a file from Microsoft PowerPoint in Google Slides. While both platforms broadly serve the same purpose, there are lots of differences between the two and we’ve noticed certain glitches and issues when you convert PowerPoint to Google Slides. Here's what to look out for.
Drop-down menus in PowerPoint allow you to create flexible, interactive slides. They can help you make interactive self-led presentations, documents, eLearning, training materials…. the list goes on!
Sometimes we struggle to find things and get frustrated when they don’t appear, whether it’s locating your house keys, finding Wally in a sea of Wally impostors or hunting down the partner to that lone sock at the bottom of the washing basket. Or maybe it’s replacing fonts that PowerPoint says are present in your file, but you just can’t find and your childhood Wally searching skills are letting you down. Well, this post can help you with PowerPoint, but you’ll have to find the sock yourself, sorry!
Do you know how to swap objects on slides with the same core name?
Like textbox1 textbox 2 textbox 3 to swap places randomly and photo1 photo2 photo3 photo4 to swap places randomly between each other, all on the same slide?
Is there any tool with this functionality, or how to fix this macro so it targets shapes with similar names:
Sub ShuffleShapesOne() Dim oSlide As Slide, oShape As Shape, iShapesCount As Integer
Set oSlide = ActivePresentation.Slides(Application.ActiveWindow.View.Slide.SlideIndex) iShapesCount = oSlide.Shapes.Count
Dim sMsg As String
If iShapesCount < 2 Then sMsg = "To run the program, more than one shape are needed in the current slide!" MsgBox sMsg, vbInformation, "Procedure Canceled" Exit Sub End If Dim oShapesNum() ReDim oShapesNum(iShapesCount)
Dim i As Integer Dim iLeft As Double, iTop As Double, iHeight As Double, iWidth As Double Dim oShapesArr() As Double ReDim oShapesArr(iShapesCount, 3) For i = 1 To iShapesCount oShapesNum(i) = i With oSlide.Shapes(i) oShapesArr(i, 0) = .Left oShapesArr(i, 1) = .Top oShapesArr(i, 2) = .Height oShapesArr(i, 3) = .Width End With Next i
Dim oShuffledArr As Variant oShuffledArr = SuffleNoReplace(oShapesNum) Dim iNum As Integer For i = 1 To iShapesCount iNum = oShuffledArr(i)
That’s definitively technically feasible Marina and we have a Custom Development service which we can offer to facilitate that for you. Where did that macro come from. We can see that there is a dependant function SuffleNoReplace that is missing. Here is the link to the custom development service: https://www.brightcarbon.com/services/powerpoint-automation/
Here is the full code, first one shuffle all on one slide, second on all slides.
I am trying to add an option to focus on objects with name + numerical value.
The developer I know created these codes for me.
SHUFFLE ALL ON ONE SLIDE
Sub ShuffleShapesOne() Dim oSlide As Slide, oShape As Shape, iShapesCount As Integer
Set oSlide = ActivePresentation.Slides(Application.ActiveWindow.View.Slide.SlideIndex) iShapesCount = oSlide.Shapes.Count
Dim sMsg As String
If iShapesCount < 2 Then sMsg = "To run the program, more than one shape are needed in the current slide!" MsgBox sMsg, vbInformation, "Procedure Canceled" Exit Sub End If Dim oShapesNum() ReDim oShapesNum(iShapesCount)
Dim i As Integer Dim iLeft As Double, iTop As Double, iHeight As Double, iWidth As Double Dim oShapesArr() As Double ReDim oShapesArr(iShapesCount, 3) For i = 1 To iShapesCount oShapesNum(i) = i With oSlide.Shapes(i) oShapesArr(i, 0) = .Left oShapesArr(i, 1) = .Top oShapesArr(i, 2) = .Height oShapesArr(i, 3) = .Width End With Next i
Dim oShuffledArr As Variant oShuffledArr = SuffleNoReplace(oShapesNum) Dim iNum As Integer For i = 1 To iShapesCount iNum = oShuffledArr(i)
If oArr(bVal) aVal And oArr(aVal) bVal Then tmp = oArr(aVal): oArr(aVal) = oArr(bVal): oArr(bVal) = tmp ok = True End If
Wend
Next
endFunc: SuffleNoReplace = oArr ‘ For i = 1 To iDim ‘ Debug.Print oArr(i) ‘ Next
End Function
SHUFFLE ALL IN ALL PPT
Sub ShuffleShapesAll()
Dim oSlide As Slide, oShape As Shape, iShapesCount As Integer
For kp = 1 To ActivePresentation.Slides.Count Set oSlide = ActivePresentation.Slides(kp) iShapesCount = oSlide.Shapes.Count
Dim sMsg As String
If iShapesCount < 2 Then sMsg = "To run the program, more than one shape are needed in the current slide!" MsgBox sMsg, vbInformation, "Procedure Canceled" Exit Sub End If Dim oShapesNum() ReDim oShapesNum(iShapesCount)
Dim i As Integer Dim iLeft As Double, iTop As Double, iHeight As Double, iWidth As Double Dim oShapesArr() As Double ReDim oShapesArr(iShapesCount, 3) For i = 1 To iShapesCount oShapesNum(i) = i With oSlide.Shapes(i) oShapesArr(i, 0) = .Left oShapesArr(i, 1) = .Top oShapesArr(i, 2) = .Height oShapesArr(i, 3) = .Width End With Next i
Dim oShuffledArr As Variant oShuffledArr = SuffleNoReplace(oShapesNum) Dim iNum As Integer For i = 1 To iShapesCount iNum = oShuffledArr(i)


Hi.
Could use help with this. Thanks.
Do you know how to swap objects on slides with the same core name?
Like textbox1 textbox 2 textbox 3 to swap places randomly and photo1 photo2 photo3 photo4 to swap places randomly between each other, all on the same slide?
Is there any tool with this functionality, or how to fix this macro so it targets shapes with similar names:
Sub ShuffleShapesOne()
Dim oSlide As Slide, oShape As Shape, iShapesCount As Integer
Set oSlide = ActivePresentation.Slides(Application.ActiveWindow.View.Slide.SlideIndex)
iShapesCount = oSlide.Shapes.Count
Dim sMsg As String
If iShapesCount < 2 Then
sMsg = "To run the program, more than one shape are needed in the current slide!"
MsgBox sMsg, vbInformation, "Procedure Canceled"
Exit Sub
End If
Dim oShapesNum()
ReDim oShapesNum(iShapesCount)
Dim i As Integer
Dim iLeft As Double, iTop As Double, iHeight As Double, iWidth As Double
Dim oShapesArr() As Double
ReDim oShapesArr(iShapesCount, 3)
For i = 1 To iShapesCount
oShapesNum(i) = i
With oSlide.Shapes(i)
oShapesArr(i, 0) = .Left
oShapesArr(i, 1) = .Top
oShapesArr(i, 2) = .Height
oShapesArr(i, 3) = .Width
End With
Next i
Dim oShuffledArr As Variant
oShuffledArr = SuffleNoReplace(oShapesNum)
Dim iNum As Integer
For i = 1 To iShapesCount
iNum = oShuffledArr(i)
With oSlide.Shapes(i)
iLeft = oShapesArr(iNum, 0)
iTop = oShapesArr(iNum, 1)
iHeight = oShapesArr(iNum, 2)
iWidth = oShapesArr(iNum, 3)
.Left = iLeft
.Top = iTop
.Height = iHeight
.Width = iWidth
End With
Next i
sMsg = "Shapes shuffled with success."
MsgBox sMsg, vbInformation, "Procedure terminated"
End Sub
That’s definitively technically feasible Marina and we have a Custom Development service which we can offer to facilitate that for you. Where did that macro come from. We can see that there is a dependant function SuffleNoReplace that is missing. Here is the link to the custom development service: https://www.brightcarbon.com/services/powerpoint-automation/
Here is the full code, first one shuffle all on one slide, second on all slides.
I am trying to add an option to focus on objects with name + numerical value.
The developer I know created these codes for me.
SHUFFLE ALL ON ONE SLIDE
Sub ShuffleShapesOne()
Dim oSlide As Slide, oShape As Shape, iShapesCount As Integer
Set oSlide = ActivePresentation.Slides(Application.ActiveWindow.View.Slide.SlideIndex)
iShapesCount = oSlide.Shapes.Count
Dim sMsg As String
If iShapesCount < 2 Then
sMsg = "To run the program, more than one shape are needed in the current slide!"
MsgBox sMsg, vbInformation, "Procedure Canceled"
Exit Sub
End If
Dim oShapesNum()
ReDim oShapesNum(iShapesCount)
Dim i As Integer
Dim iLeft As Double, iTop As Double, iHeight As Double, iWidth As Double
Dim oShapesArr() As Double
ReDim oShapesArr(iShapesCount, 3)
For i = 1 To iShapesCount
oShapesNum(i) = i
With oSlide.Shapes(i)
oShapesArr(i, 0) = .Left
oShapesArr(i, 1) = .Top
oShapesArr(i, 2) = .Height
oShapesArr(i, 3) = .Width
End With
Next i
Dim oShuffledArr As Variant
oShuffledArr = SuffleNoReplace(oShapesNum)
Dim iNum As Integer
For i = 1 To iShapesCount
iNum = oShuffledArr(i)
With oSlide.Shapes(i)
iLeft = oShapesArr(iNum, 0)
iTop = oShapesArr(iNum, 1)
iHeight = oShapesArr(iNum, 2)
iWidth = oShapesArr(iNum, 3)
.Left = iLeft
.Top = iTop
.Height = iHeight
.Width = iWidth
End With
Next i
sMsg = "Shapes shuffled with success."
MsgBox sMsg, vbInformation, "Procedure terminated"
End Sub
Function SuffleNoReplace(ByVal oArr As Variant) As Variant
Dim iDim As Integer
iDim = UBound(oArr)
Randomize Timer
'Dim i As Integer, aVal As Integer, ok As Boolean, bVal As Integer, tmp As Integer
Dim i, aVal, ok As Boolean, bVal, tmp
If iDim = 2 Then
oArr(1) = 2
oArr(2) = 1
GoTo endFunc
End If
For i = 1 To iDim
aVal = i 'sujet A
ok = False
While ok = False
bVal = aVal
While bVal = aVal
bVal = Int(iDim * Rnd) + 1
Wend
If oArr(bVal) aVal And oArr(aVal) bVal Then
tmp = oArr(aVal): oArr(aVal) = oArr(bVal): oArr(bVal) = tmp
ok = True
End If
Wend
Next
endFunc:
SuffleNoReplace = oArr
‘ For i = 1 To iDim
‘ Debug.Print oArr(i)
‘ Next
End Function
SHUFFLE ALL IN ALL PPT
Sub ShuffleShapesAll()
Dim oSlide As Slide, oShape As Shape, iShapesCount As Integer
For kp = 1 To ActivePresentation.Slides.Count
Set oSlide = ActivePresentation.Slides(kp)
iShapesCount = oSlide.Shapes.Count
Dim sMsg As String
If iShapesCount < 2 Then
sMsg = "To run the program, more than one shape are needed in the current slide!"
MsgBox sMsg, vbInformation, "Procedure Canceled"
Exit Sub
End If
Dim oShapesNum()
ReDim oShapesNum(iShapesCount)
Dim i As Integer
Dim iLeft As Double, iTop As Double, iHeight As Double, iWidth As Double
Dim oShapesArr() As Double
ReDim oShapesArr(iShapesCount, 3)
For i = 1 To iShapesCount
oShapesNum(i) = i
With oSlide.Shapes(i)
oShapesArr(i, 0) = .Left
oShapesArr(i, 1) = .Top
oShapesArr(i, 2) = .Height
oShapesArr(i, 3) = .Width
End With
Next i
Dim oShuffledArr As Variant
oShuffledArr = SuffleNoReplace(oShapesNum)
Dim iNum As Integer
For i = 1 To iShapesCount
iNum = oShuffledArr(i)
With oSlide.Shapes(i)
iLeft = oShapesArr(iNum, 0)
iTop = oShapesArr(iNum, 1)
iHeight = oShapesArr(iNum, 2)
iWidth = oShapesArr(iNum, 3)
.Left = iLeft
.Top = iTop
.Height = iHeight
.Width = iWidth
End With
Next i
Next
End Sub
Function SuffleNoReplace(ByVal oArr As Variant) As Variant
Dim iDim As Integer
iDim = UBound(oArr)
Randomize Timer
'Dim i As Integer, aVal As Integer, ok As Boolean, bVal As Integer, tmp As Integer
Dim i, aVal, ok As Boolean, bVal, tmp
If iDim = 2 Then
oArr(1) = 2
oArr(2) = 1
GoTo endFunc
End If
For i = 1 To iDim
aVal = i 'sujet A
ok = False
While ok = False
bVal = aVal
While bVal = aVal
bVal = Int(iDim * Rnd) + 1
Wend
If oArr(bVal) aVal And oArr(aVal) bVal Then
tmp = oArr(aVal): oArr(aVal) = oArr(bVal): oArr(bVal) = tmp
ok = True
End If
Wend
Next
endFunc:
SuffleNoReplace = oArr
‘ For i = 1 To iDim
‘ Debug.Print oArr(i)
‘ Next
End Function